

Answered step by step
Verified Expert Solution
Question
1 Approved Answer
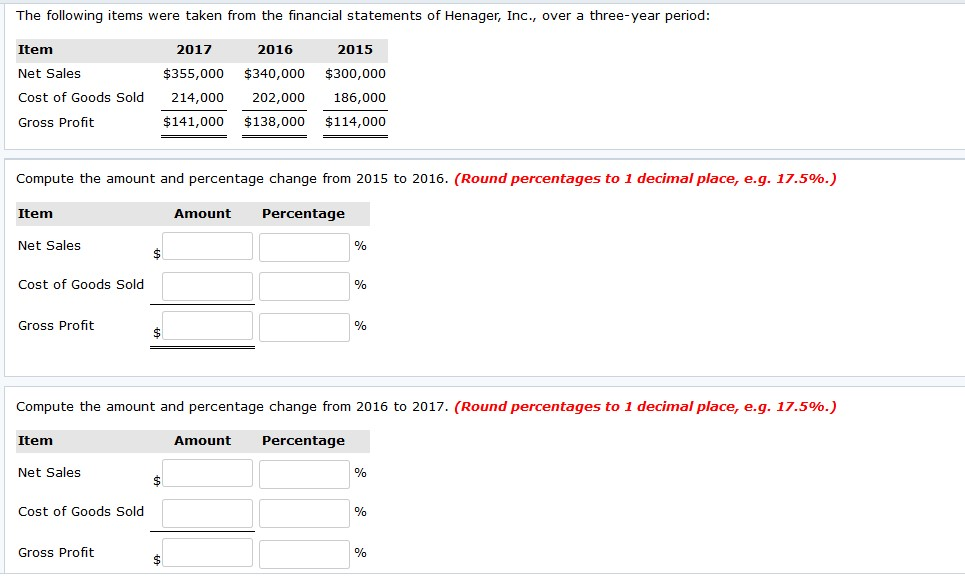
The following items were taken from the financial statements of Henager, Inc., over a three-year period: 2016 2015 Item Net Sales Cost of Goods Sold
Step by Step Solution
There are 3 Steps involved in it
Step: 1

Get Instant Access to Expert-Tailored Solutions
See step-by-step solutions with expert insights and AI powered tools for academic success
Step: 2

Step: 3
Ace Your Homework with AI
Get the answers you need in no time with our AI-driven, step-by-step assistance
Get Started
Audit Skill Management Ref PPAP ISO 9000 And ISO 14000 Series
Authors: FULBODH CHAUDHARY
1st Edition
1520470843, 978-1520470849