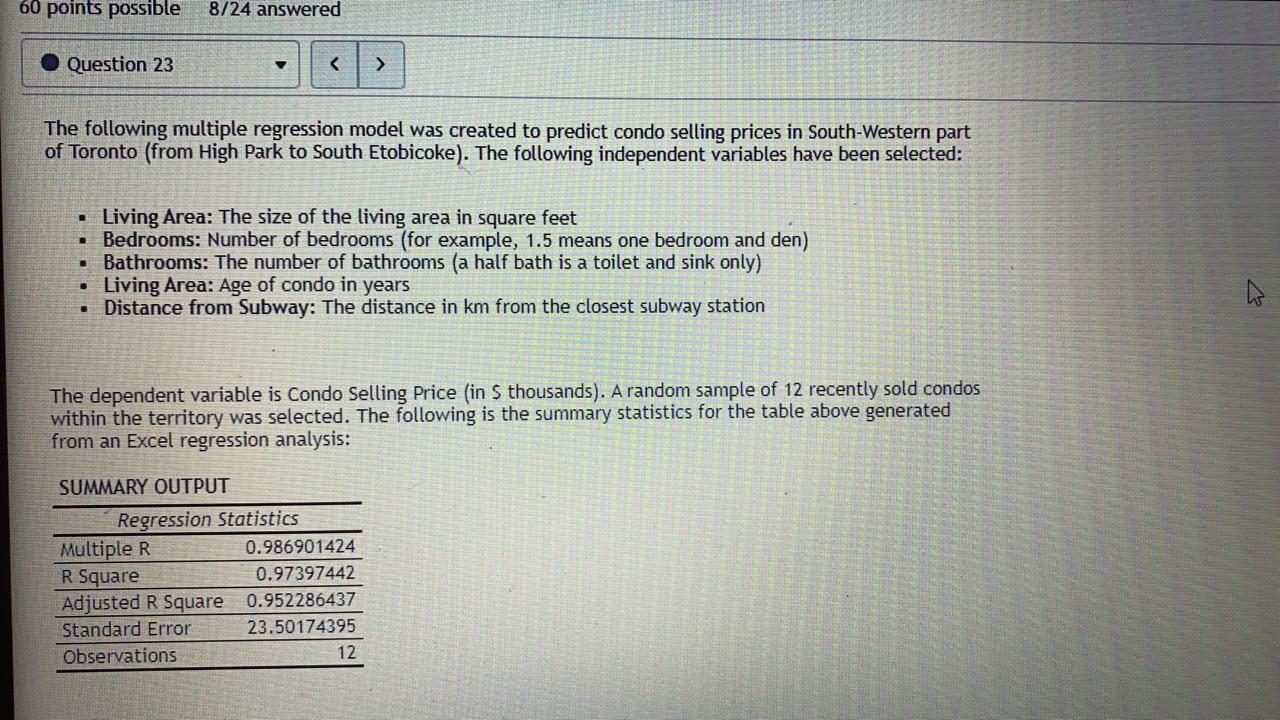
The following multiple regression model was created to predict condo selling prices in South-Western part of Toronto (from High Park to South Etobicoke). The following independent variables have been selected:
Living Area: The size of the living area in square feet
Bedrooms: Number of bedrooms (for example, 1.5 means one bedroom and den)
Bathrooms: The number of bathrooms (a half bath is a toilet and sink only)
Living Area: Age of condo in years
Distance from Subway: The distance in km from the closest subway station
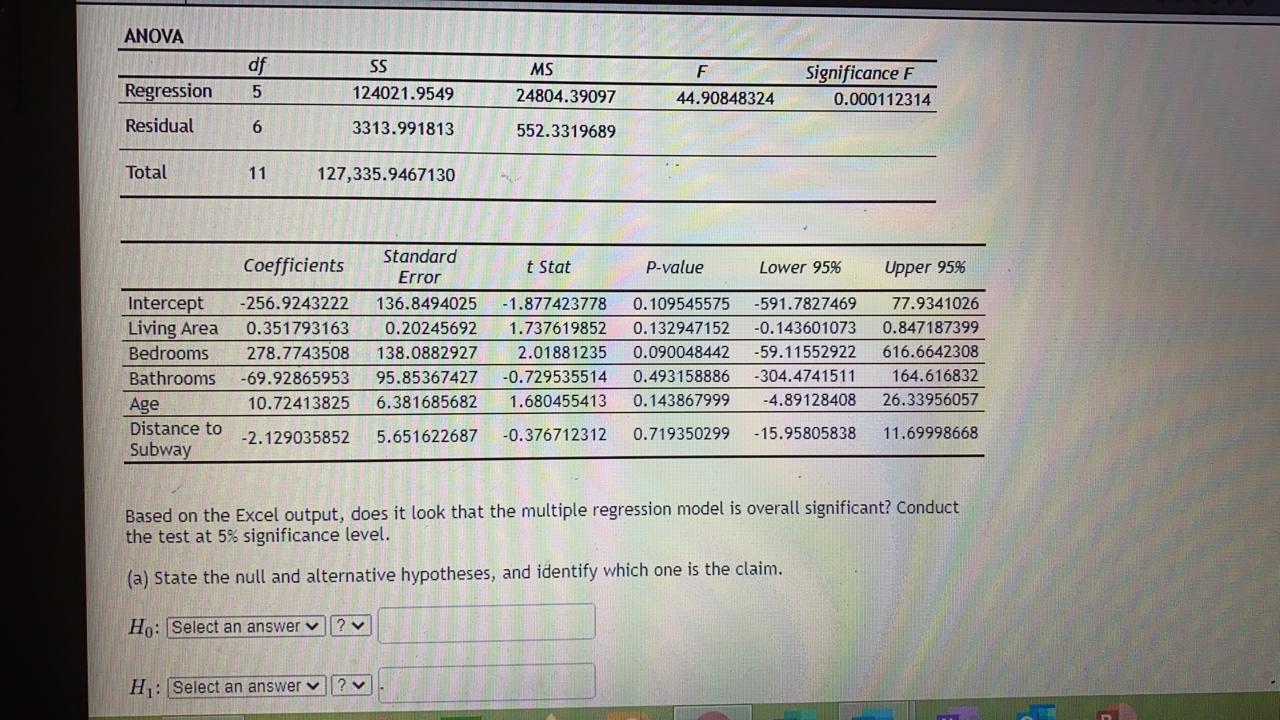
The dependent variable is Condo Selling Price (in $ thousands). A random sample of 12 recently sold condos within the territory was selected. The following is the summary statistics for the table above generated from an Excel regression analysis:
60 points possible 8/24 answered Question 23 The following multiple regression model was created to predict condo selling prices in South-Western part of Toronto (from High Park to South Etobicoke). The following independent variables have been selected: . Living Area: The size of the living area in square feet Bedrooms: Number of bedrooms (for example, 1.5 means one bedroom and den) Bathrooms: The number of bathrooms (a half bath is a toilet and sink only) Living Area: Age of condo in years . Distance from Subway: The distance in km from the closest subway station The dependent variable is Condo Selling Price (in $ thousands). A random sample of 12 recently sold condos within the territory was selected. The following is the summary statistics for the table above generated from an Excel regression analysis: SUMMARY OUTPUT Regression Statistics Multiple R 0.986901424 R Square 0.97397442 Adjusted R Square 0.952286437 Standard Error 23.50174395 Observations 12ANOVA df SS MS F Significance F Regression 5 124021.9549 24804.39097 44.90848324 0.000112314 Residual 6 3313.991813 552.3319689 Total 11 127,335.9467130 Coefficients Standard Error t Stat P-value Lower 95% Upper 95% Intercept -256.9243222 136.8494025 -1.877423778 0. 109545575 -591.7827469 77.9341026 Living Area 0.351793163 0.20245692 1.737619852 0. 132947152 -0. 143601073 0.847187399 Bedrooms 278.7743508 138.0882927 2.01881235 0.090048442 59.11552922 616.6642308 Bathrooms -69.92865953 95.85367427 -0.729535514 0.493158886 -304.4741511 164.616832 Age 10.72413825 6.381685682 1.680455413 0. 143867999 -4.89128408 26.33956057 Distance to -2. 129035852 5.651622687 -0.376712312 0.719350299 -15.95805838 11.69998668 Subway Based on the Excel output, does it look that the multiple regression model is overall significant? Conduct the test at 5% significance level. (a) State the null and alternative hypotheses, and identify which one is the claim. Ho: Select an answer v ? v H1 : Select an answer v ? vWhich one is the claim: OH1 O Ho For part (b), round your answer to 5 decimal places. (b) What is the test P-value that should be used in your hypothesis test? (c) Is the null hypothesis rejected? O Yes O No (d) Is the claim supported? O.Yes, at 5% significance level, there is at least one significant predictor of condo selling price. The model is overall significant. No, at 5% significance level, there is not a significant predictor of condo selling price. The model is overall not significant. imal placesFor part (e), round your answers to 4 decimal places. (e) Write the regression equation below. y I3 For part (f), round your final answer to 2 decimal places. Make sure you use correct units in your calculation and present your final answer in dollars $, not in $ thousands. (f) What would be the predicted selling price (in 5) for a condo in South Etobicoke with the following parameters: 1,876 sq. ft. area, 3 bedrooms and den, 2 full bathrooms and one half bath? The condo was built 14 years ago and is located just 754 meters from Kipling subway station. Add Work


