

Answered step by step
Verified Expert Solution
Question
1 Approved Answer
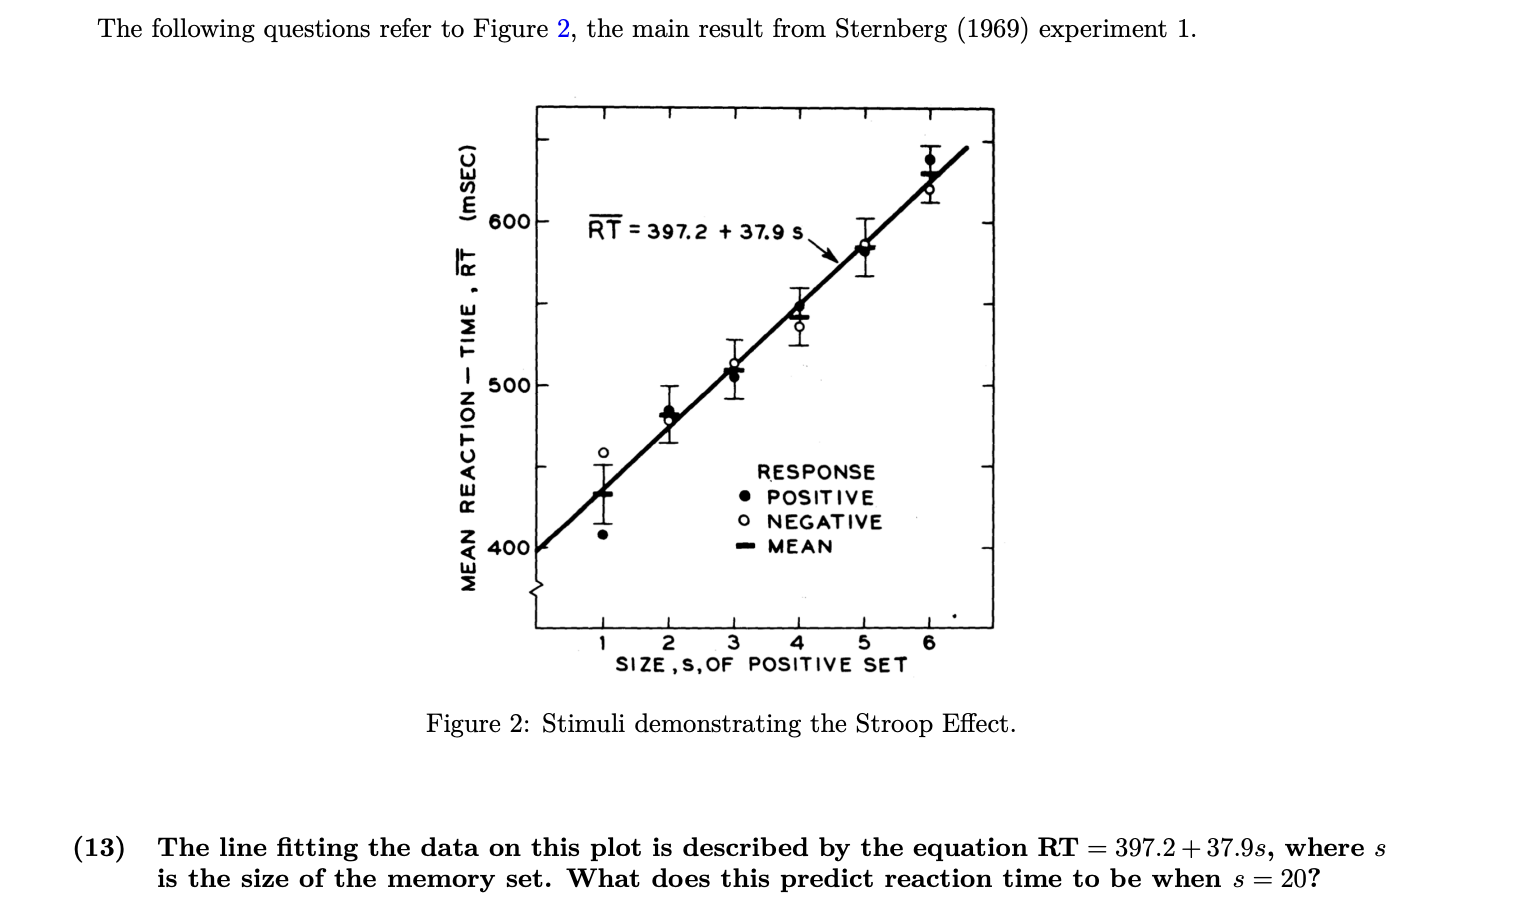
The following questions refer to Figure 2 , the main result from Sternberg ( 1 9 6 9 ) experiment 1 . Figure 2 :
The following questions refer to Figure the main result from Sternberg experiment
Figure : Stimuli demonstrating the Stroop Effect.
The line fitting the data on this plot is described by the equation where is the size of the memory set. What does this predict reaction time to be when
Step by Step Solution
There are 3 Steps involved in it
Step: 1

Get Instant Access to Expert-Tailored Solutions
See step-by-step solutions with expert insights and AI powered tools for academic success
Step: 2

Step: 3
Ace Your Homework with AI
Get the answers you need in no time with our AI-driven, step-by-step assistance
Get Started
Contemporary Auditing
Authors: Michael C. Knapp
8th edition
978-0538466790, 538466790, 978-1285066608