Question
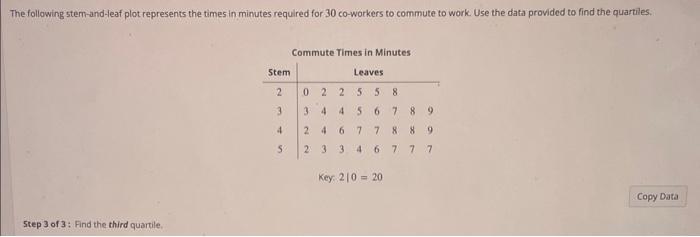
The following stem-and-leaf plot represents the times in minutes required for 30 co-workers to commute to work. Use the data provided to find the

The following stem-and-leaf plot represents the times in minutes required for 30 co-workers to commute to work. Use the data provided to find the quartiles. Step 3 of 3: Find the third quartile. Stem 2 3 4 5 Commute Times in Minutes Leaves 02 2 5 34 4 5 2 4 6 2 3 58 6 7 89 7 7 8 8 9 7 34 6 77 Key: 210 20 Copy Data
Step by Step Solution
There are 3 Steps involved in it
Step: 1
The image shows a stemandleaf plot representing commute times in minutes for 30 coworkers We ...
Get Instant Access to Expert-Tailored Solutions
See step-by-step solutions with expert insights and AI powered tools for academic success
Step: 2

Step: 3

Ace Your Homework with AI
Get the answers you need in no time with our AI-driven, step-by-step assistance
Get StartedRecommended Textbook for
Practicing Statistics Guided Investigations For The Second Course
Authors: Shonda Kuiper, Jeff Sklar
1st Edition
321586018, 978-0321586018
Students also viewed these Mathematics questions
Question
Answered: 1 week ago
Question
Answered: 1 week ago
Question
Answered: 1 week ago
Question
Answered: 1 week ago
Question
Answered: 1 week ago
Question
Answered: 1 week ago
Question
Answered: 1 week ago
Question
Answered: 1 week ago
Question
Answered: 1 week ago
Question
Answered: 1 week ago
Question
Answered: 1 week ago
Question
Answered: 1 week ago
Question
Answered: 1 week ago
Question
Answered: 1 week ago
Question
Answered: 1 week ago
Question
Answered: 1 week ago
Question
Answered: 1 week ago
Question
Answered: 1 week ago
Question
Answered: 1 week ago
Question
Answered: 1 week ago
Question
Answered: 1 week ago
Question
Answered: 1 week ago
Question
Answered: 1 week ago
Question
Answered: 1 week ago
View Answer in SolutionInn App


