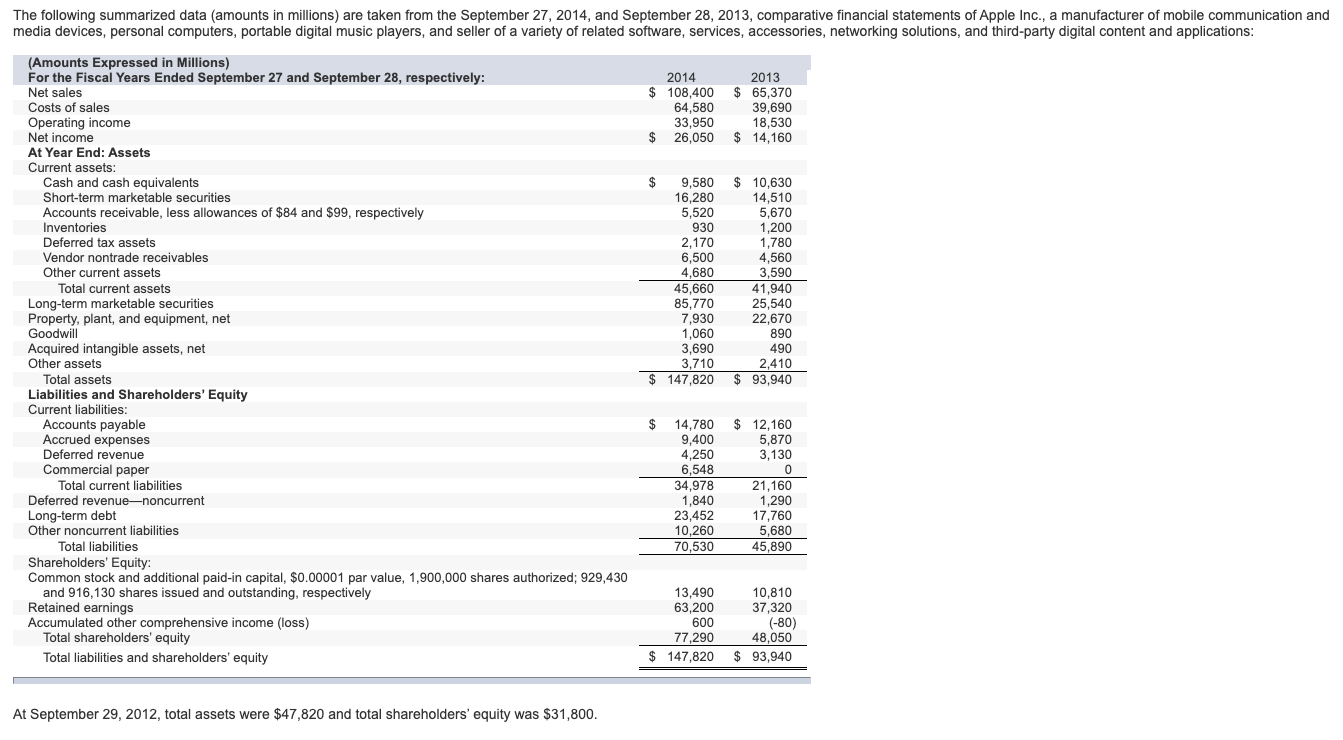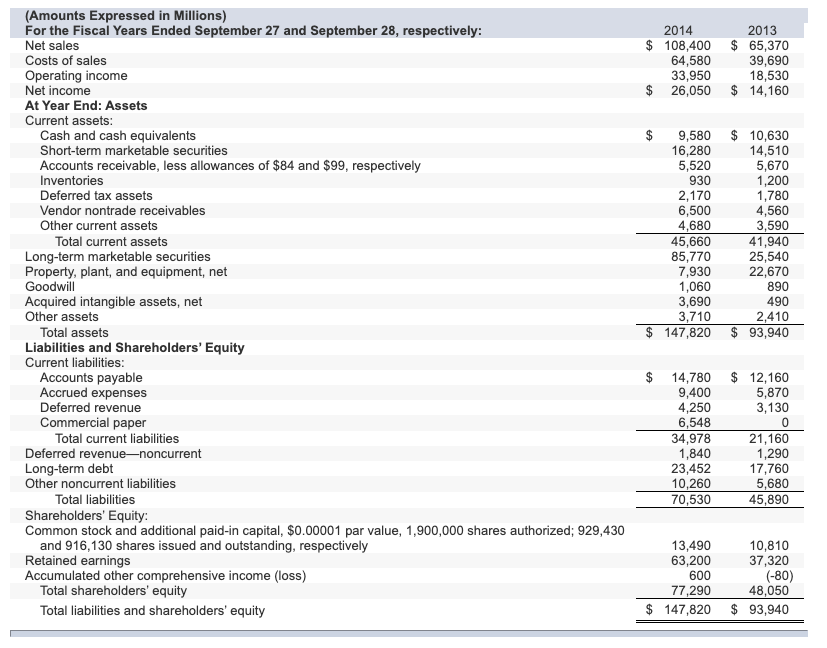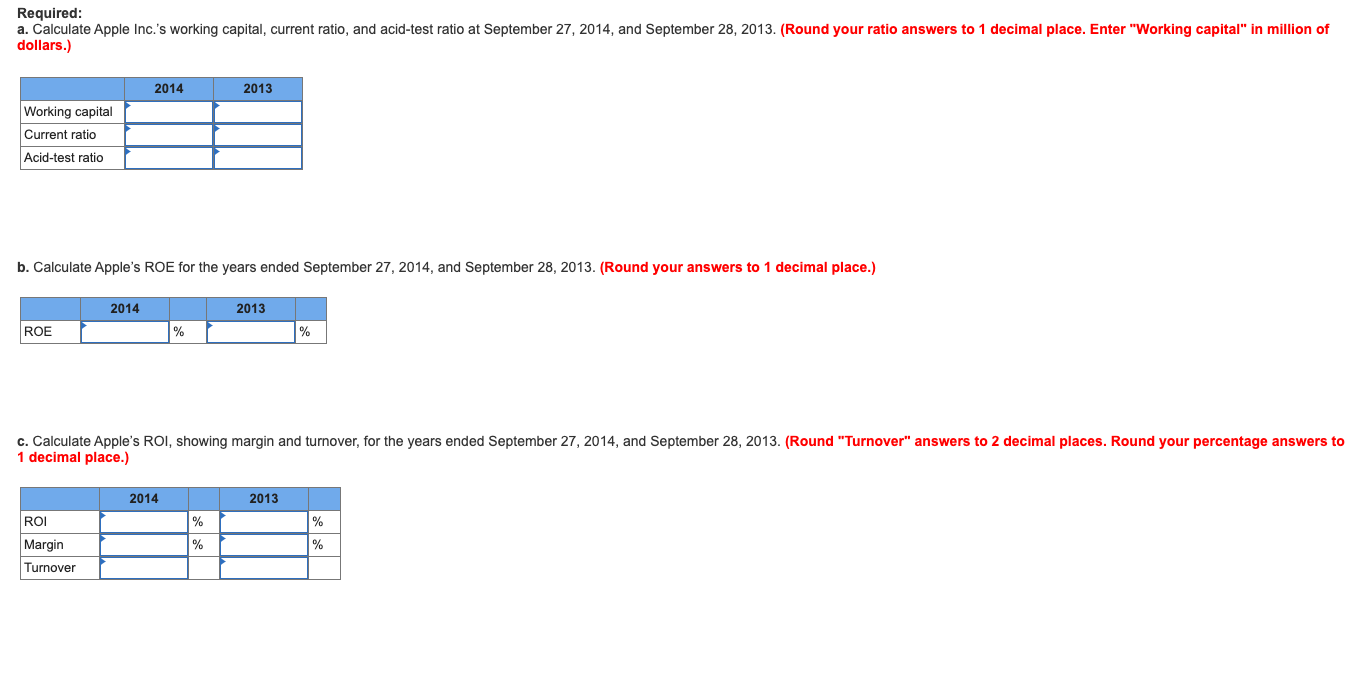


The following summarized data (amounts in millions) are taken from the September 27, 2014, and September 28, 2013, comparative financial statements of Apple Inc., a manufacturer of mobile communication and media devices, personal computers, portable digital music players, and seller of a variety of related software, services, accessories, networking solutions, and third-party digital content and applications: 2014 $ 108,400 64,580 33,950 $ 26,050 2013 $ 65,370 39,690 18,530 $ 14,160 $ 9,580 16.280 5,520 930 2.170 $ 10,630 14,510 5,670 1,200 1,780 4,560 3,590 41,940 6,500 4,680 45,660 85,770 25,540 (Amounts Expressed in Millions) For the Fiscal Years Ended September 27 and September 28, respectively: Net sales Costs of sales Operating income Net income At Year End: Assets Current assets: Cash and cash equivalents Short-term marketable securities Accounts receivable, less allowances of $84 and $99, respectively Inventories Deferred tax assets Vendor nontrade receivables Other current assets Total current assets Long-term marketable securities Property, plant, and equipment, net Goodwill Acquired intangible assets, net Other assets Total assets Liabilities and Shareholders' Equity Current liabilities: Accounts payable Accrued expenses Deferred revenue Commercial paper Total current liabilities Deferred revenuenoncurrent Long-term debt Other noncurrent liabilities Total liabilities Shareholders' Equity Common stock and additional paid-in capital, $0.00001 par value, 1,900,000 shares authorized; 929,430 and 916,130 shares issued and outstanding, respectively Retained earnings Accumulated other comprehensive income (loss) Total shareholders' equity Total liabilities and shareholders' equity 7,930 1,060 3,690 3,710 22,670 890 490 2,410 $ 93,940 $ 147,820 $ 14,780 9,400 4,250 6,548 34,978 1,840 23,452 10.260 70,530 $ 12,160 5,870 3,130 0 21,160 1,290 17,760 5,680 45,890 13,490 63,200 600 77,290 $ 147,820 10,810 37,320 (-80) 48,050 $ 93,940 At September 29, 2012, total assets were $47,820 and total shareholders' equity was $31,800. 2014 $ 108,400 64,580 33,950 26,050 2013 $ 65,370 39,690 18,530 $ 14,160 $ (Amounts Expressed in Millions) For the Fiscal Years Ended September 27 and September 28, respectively: Net sales Costs of sales Operating income Net income At Year End: Assets Current assets: Cash and cash equivalents Short-term marketable securities Accounts receivable, less allowances of $84 and $99, respectively Inventories Deferred tax assets Vendor nontrade receivables Other current assets Total current assets Long-term marketable securities Property, plant, and equipment, net Goodwill Acquired intangible assets, net Other assets Total assets Liabilities and Shareholders' Equity Current liabilities: Accounts payable Accrued expenses Deferred revenue Commercial paper Total current liabilities Deferred revenuenoncurrent Long-term debt Other noncurrent liabilities Total liabilities Shareholders' Equity: Common stock and additional paid-in capital, $0.00001 par value, 1,900,000 shares authorized; 929,430 and 916,130 shares issued and outstanding, respectively Retained earnings Accumulated other comprehensive income (loss) Total shareholders' equity Total liabilities and shareholders' equity $ 9,580 16,280 5,520 930 2,170 6,500 4,680 45,660 85,770 7,930 1,060 3,690 3,710 $ 147,820 $ 10,630 14,510 5,670 1,200 1,780 4,560 3,590 41,940 25,540 22,670 890 490 2,410 $ 93,940 14,780 9,400 4,250 6,548 34,978 1,840 23,452 10,260 70,530 12,160 5,870 3,130 0 21,160 1,290 17,760 5,680 45,890 13,490 63,200 600 77,290 $ 147,820 10,810 37,320 (-80) 48,050 $ 93,940 Required: a. Calculate Apple Inc.'s working capital, current ratio, and acid-test ratio at September 27, 2014, and September 28, 2013. (Round your ratio answers to 1 decimal place. Enter "Working capital" in million of dollars.) 2014 2013 Working capital Current ratio Acid-test ratio b. Calculate Apple's ROE for the years ended September 27, 2014, and September 28, 2013. (Round your answers to 1 decimal place.) 2014 2013 ROE % % c. Calculate Apple's ROI, showing margin and turnover, for the years ended September 27, 2014, and September 28, 2013. (Round "Turnover" answers to 2 decimal places. Round your percentage answers to 1 decimal place.) 2014 2013 ROI % % % Margin % Turnover


