Answered step by step
Verified Expert Solution
Question
1 Approved Answer
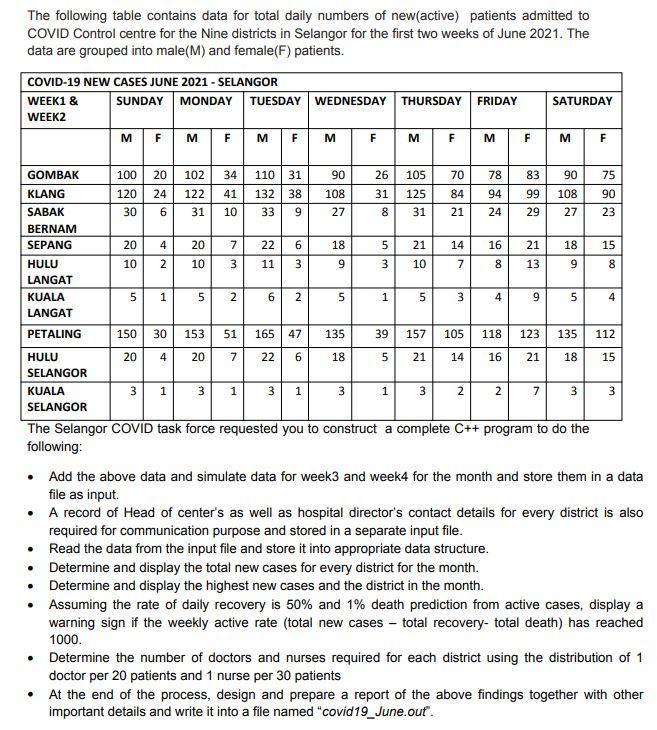
The following table contains data for total daily numbers of new(active) patients admitted to COVID Control centre for the Nine districts in Selangor for

The following table contains data for total daily numbers of new(active) patients admitted to COVID Control centre for the Nine districts in Selangor for the first two weeks of June 2021. The data are grouped into male(M) and female(F) patients. COVID-19 NEW CASES JUNE 2021 - SELANGOR WEEK1 & SUNDAY MONDAY WEDNESDAY THURSDAY TUESDAY FRIDAY SATURDAY WEEK2 M F M F F M M M F M F M F GOMBAK 100 20 102 34 110 31 90 26 105 70 78 83 90 75 KLANG 120 24 122 41 132 38 108 31 125 84 94 99 108 90 SABAK 30 6. 31 10 33 9 27 8 31 21 24 29 27 23 BERNAM SEPANG 20 4 20 7 22 18 21 14 16 21 18 15 HULU 10 2 10 3 11 3 10 7 8. 13 8 LANGAT KUALA 5. 6. 1 9 5 LANGAT PETALING 150 30 153 51 165 47 135 39 157 105 118 123 135 112 HULU 20 4 20 22 18 21 14 16 21 18 15 SELANGOR KUALA 3 3. 1 3 3 SELANGOR The Selangor COVID task force requested you to construct a complete C++ program to do the following: Add the above data and simulate data for week3 and week4 for the month and store them in a data file as input. A record of Head of center's as well as hospital director's contact details for every district is also required for communication purpose and stored in a separate input file. Read the data from the input file and store it into appropriate data structure. Determine and display the total new cases for every district for the month. Determine and display the highest new cases and the district in the month. Assuming the rate of daily recovery is 50% and 1% death prediction from active cases, display a warning sign if the weekly active rate (total new cases - total recovery- total death) has reached 1000. Determine the number of doctors and nurses required for each district using the distribution of 1 doctor per 20 patients and 1 nurse per 30 patients At the end of the process, design and prepare a report of the above findings together with other important details and write it into a file named "covid19_June.out. 4, 3. 00 o 2. 3. 2. in m 3. 6. 7, 1.
Step by Step Solution
★★★★★
3.49 Rating (156 Votes )
There are 3 Steps involved in it
Step: 1
CODE includeciostream include include using namespac...
Get Instant Access to Expert-Tailored Solutions
See step-by-step solutions with expert insights and AI powered tools for academic success
Step: 2

Step: 3

Ace Your Homework with AI
Get the answers you need in no time with our AI-driven, step-by-step assistance
Get Started


