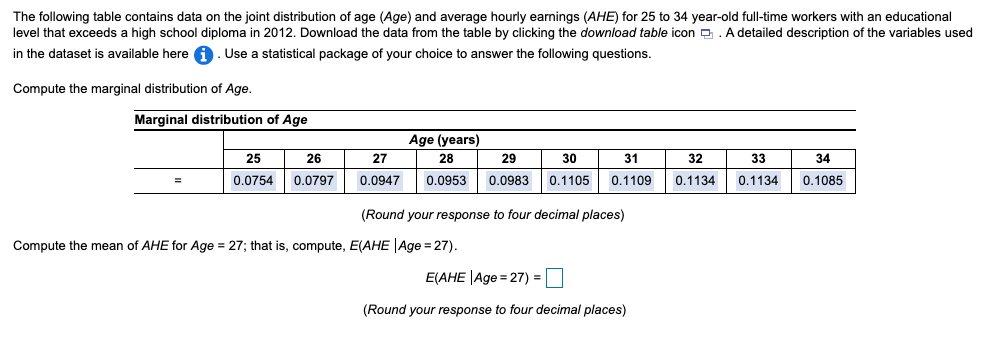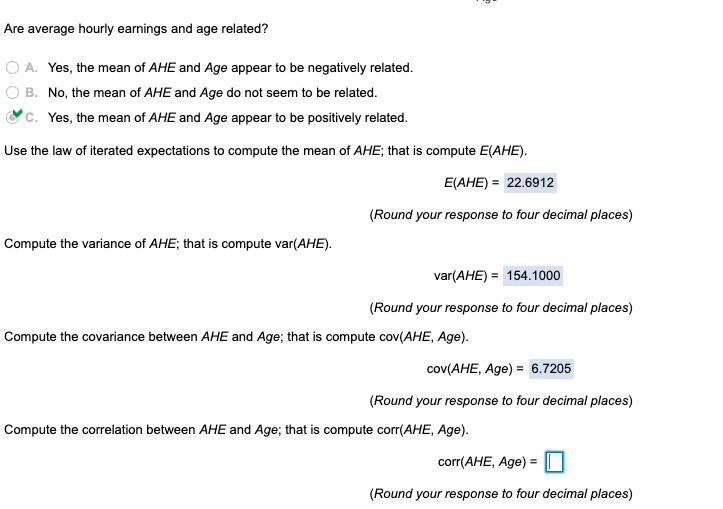

The following table contains data on the joint distribution of age (Age) and average hourly earnings (AHE) for 25 to 34 year-old full-time workers with an educational level that exceeds a high school diploma in 2012. Download the data from the table by clicking the download table icon 2. A detailed description of the variables used in the dataset is available here . Use a statistical package of your choice to answer the following questions. Compute the marginal distribution of Age. Marginal distribution of Age Age (years) 28 25 27 30 31 32 33 34 26 0.0797 29 0.0983 0.0754 0.0947 0.0953 0.1105 0.1109 0.1134 0.1134 0.1085 (Round your response to four decimal places) Compute the mean of AHE for Age = 27; that is, compute, E(AHE |Age = 27). E(AHE |Age = 27) = (Round your response to four decimal places) Are average hourly earnings and age related? A. Yes, the mean of AHE and Age appear to be negatively related. B. No, the mean of AHE and Age do not seem to be related. C. Yes, the mean of AHE and Age appear to be positively related. Use the law of iterated expectations to compute the mean of AHE; that is compute E(AHE). E(AHE) = 22.6912 (Round your response to four decimal places) Compute the variance of AHE; that is compute var(AHE). var(AHE) = 154.1000 (Round your response to four decimal places) Compute the covariance between AHE and Age; that is compute cov(AHE, Age). cov(AHE, Age) = 6.7205 (Round your response to four decimal places) Compute the correlation between AHE and Age; that is compute corr(AHE, Age). corr(AHE, Age) = 0 (Round your response to four decimal places) The following table contains data on the joint distribution of age (Age) and average hourly earnings (AHE) for 25 to 34 year-old full-time workers with an educational level that exceeds a high school diploma in 2012. Download the data from the table by clicking the download table icon 2. A detailed description of the variables used in the dataset is available here . Use a statistical package of your choice to answer the following questions. Compute the marginal distribution of Age. Marginal distribution of Age Age (years) 28 25 27 30 31 32 33 34 26 0.0797 29 0.0983 0.0754 0.0947 0.0953 0.1105 0.1109 0.1134 0.1134 0.1085 (Round your response to four decimal places) Compute the mean of AHE for Age = 27; that is, compute, E(AHE |Age = 27). E(AHE |Age = 27) = (Round your response to four decimal places) Are average hourly earnings and age related? A. Yes, the mean of AHE and Age appear to be negatively related. B. No, the mean of AHE and Age do not seem to be related. C. Yes, the mean of AHE and Age appear to be positively related. Use the law of iterated expectations to compute the mean of AHE; that is compute E(AHE). E(AHE) = 22.6912 (Round your response to four decimal places) Compute the variance of AHE; that is compute var(AHE). var(AHE) = 154.1000 (Round your response to four decimal places) Compute the covariance between AHE and Age; that is compute cov(AHE, Age). cov(AHE, Age) = 6.7205 (Round your response to four decimal places) Compute the correlation between AHE and Age; that is compute corr(AHE, Age). corr(AHE, Age) = 0 (Round your response to four decimal places)


