

Answered step by step
Verified Expert Solution
Question
1 Approved Answer
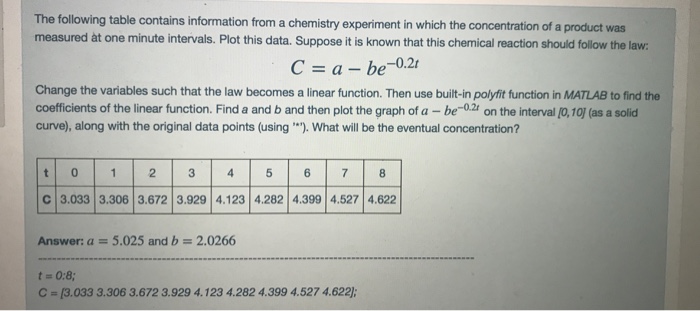
The following table contains information from a chemistry experiment in which the concentration of a product was measured at one minute intervals. Plot this data.
Step by Step Solution
There are 3 Steps involved in it
Step: 1

Get Instant Access to Expert-Tailored Solutions
See step-by-step solutions with expert insights and AI powered tools for academic success
Step: 2

Step: 3
Ace Your Homework with AI
Get the answers you need in no time with our AI-driven, step-by-step assistance
Get Started
Intelligent Databases Object Oriented Deductive Hypermedia Technologies
Authors: Kamran Parsaye, Mark Chignell, Setrag Khoshafian, Harry Wong
1st Edition
0471503452, 978-0471503453