Answered step by step
Verified Expert Solution
Question
1 Approved Answer
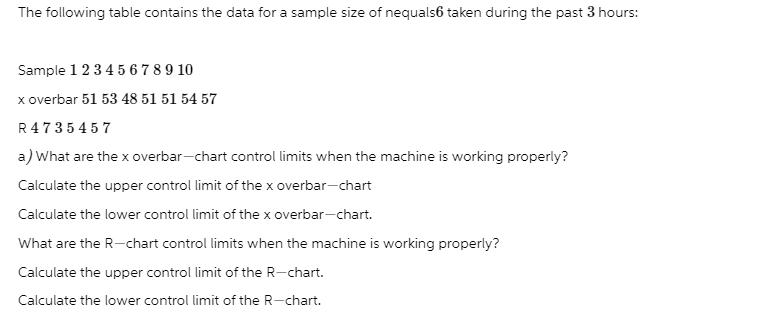
The following table contains the data for a sample size of nequals6 taken during the past 3 hours: Sample 1 2 3 4 5

![]()
The following table contains the data for a sample size of nequals6 taken during the past 3 hours: Sample 1 2 3 4 5 6 7 8 9 10 x overbar 51 53 48 51 51 54 57 R4735457 a) What are the x overbar-chart control limits when the machine is working properly? Calculate the upper control limit of the x overbar-chart Calculate the lower control limit of the x overbar-chart. What are the R-chart control limits when the machine is working properly? Calculate the upper control limit of the R-chart. Calculate the lower control limit of the R-chart. The process is in control if all sample mean and range values are within the control limits. What seems to be happening? Has the process been in control? Yes or no?
Step by Step Solution
★★★★★
3.42 Rating (155 Votes )
There are 3 Steps involved in it
Step: 1
To calculate the control limits for the x xbar chart and Rchart you will need to use the average ran...
Get Instant Access to Expert-Tailored Solutions
See step-by-step solutions with expert insights and AI powered tools for academic success
Step: 2

Step: 3

Ace Your Homework with AI
Get the answers you need in no time with our AI-driven, step-by-step assistance
Get Started


