Answered step by step
Verified Expert Solution
Question
1 Approved Answer
The following table contains the historic returns from large stocks and long-term Treasury bonds over the last 20 years. Analyze the risk-return trade-off that would
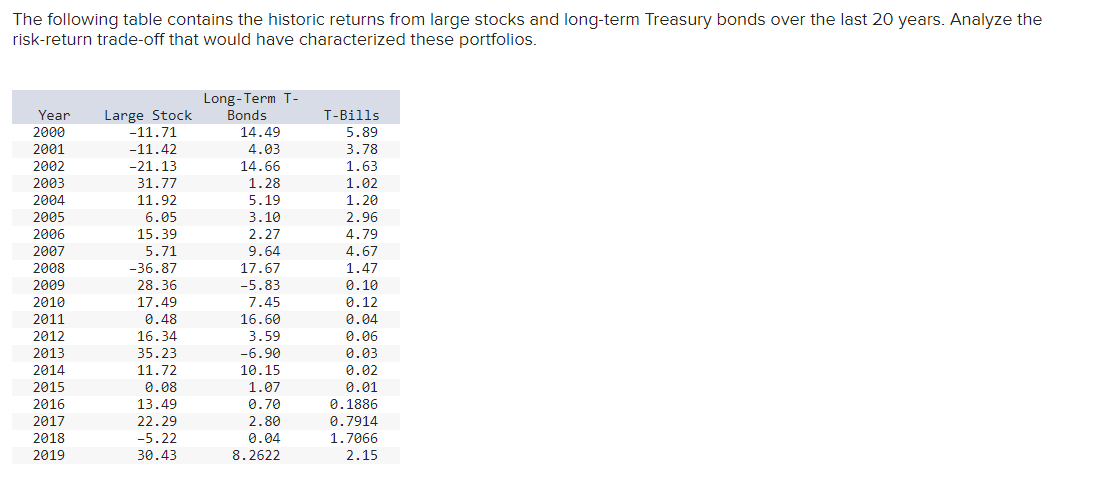
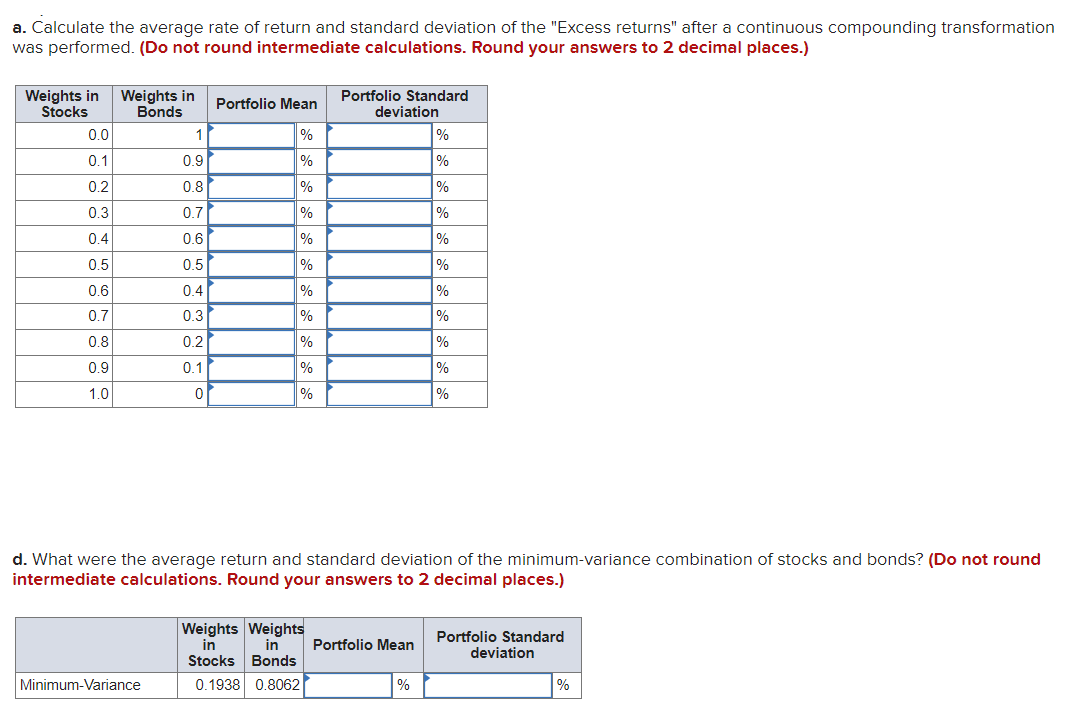
The following table contains the historic returns from large stocks and long-term Treasury bonds over the last 20 years. Analyze the risk-return trade-off that would have characterized these portfolios. T-Bills 5.89 3.78 1.63 1.02 1.20 2.96 Year 2000 2001 2002 2003 2004 2005 2006 2007 2008 2009 2010 2011 2012 2013 2014 2015 2016 2017 2018 2019 Large Stock -11.71 -11.42 -21.13 31.77 11.92 6.05 15.39 5.71 -36.87 28.36 17.49 0.48 16.34 35.23 11.72 0.08 13.49 22.29 -5.22 30.43 Long-Term T- Bonds 14.49 4.03 14.66 1.28 5.19 3.10 2.27 9.64 17.67 -5.83 7.45 16.60 3.59 -6.90 10.15 1.07 0.70 2.80 0.04 8.2622 4.79 4.67 1.47 0.10 0.12 0.04 0.06 0.03 0.02 0.01 0.1886 0.7914 1.7066 2.15 a. Calculate the average rate of return and standard deviation of the "Excess returns" after a continuous compounding transformation was performed. (Do not round intermediate calculations. Round your answers to 2 decimal places.) Weights in Stocks 0.0 Weights in Bonds Portfolio Mean Portfolio Standard deviation % 1 % 0.1 0.9 % % 0.2 0.8 % % 0.3 0.7 % % 0.4 0.6 % % 0.5 0.5 % % 0.6 0.4 % % % 0.7 0.3 % 0.8 0.2 % % 0.9 0.1 % % 1.0 0 % % d. What were the average return and standard deviation of the minimum-variance combination of stocks and bonds? (Do not round intermediate calculations. Round your answers to 2 decimal places.) Portfolio Mean Weights Weights in in Stocks Bonds 0.1938 0.8062 Portfolio Standard deviation Minimum-Variance % %
Step by Step Solution
There are 3 Steps involved in it
Step: 1
Get Instant Access to Expert-Tailored Solutions
See step-by-step solutions with expert insights and AI powered tools for academic success
Step: 2
Step: 3
Ace Your Homework with AI
Get the answers you need in no time with our AI-driven, step-by-step assistance
Get Started