Question
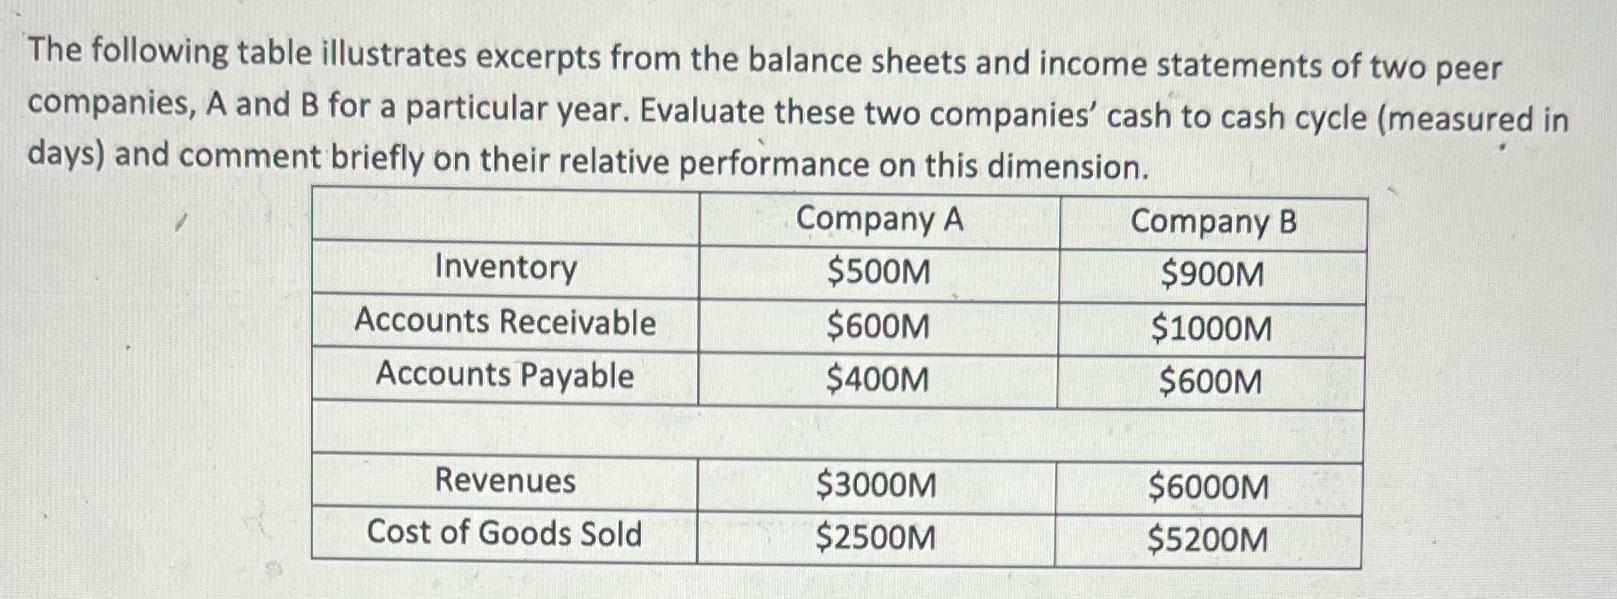
The following table illustrates excerpts from the balance sheets and income statements of two peer companies, A and B for a particular year. Evaluate

The following table illustrates excerpts from the balance sheets and income statements of two peer companies, A and B for a particular year. Evaluate these two companies' cash to cash cycle (measured in days) and comment briefly on their relative performance on this dimension. Company B Company A Inventory $500M $900M Accounts Receivable $600M $1000M Accounts Payable $400M $600M Revenues $3000M $6000M Cost of Goods Sold $2500M $5200M
Step by Step Solution
There are 3 Steps involved in it
Step: 1
Answer To calculate the cashtocash cycle for each company we need to consider the average number of ...
Get Instant Access to Expert-Tailored Solutions
See step-by-step solutions with expert insights and AI powered tools for academic success
Step: 2

Step: 3

Ace Your Homework with AI
Get the answers you need in no time with our AI-driven, step-by-step assistance
Get StartedRecommended Textbook for
Financial Statement Analysis
Authors: K. R. Subramanyam, John Wild
11th edition
78110963, 978-0078110962
Students also viewed these Economics questions
Question
Answered: 1 week ago
Question
Answered: 1 week ago
Question
Answered: 1 week ago
Question
Answered: 1 week ago
Question
Answered: 1 week ago
Question
Answered: 1 week ago
Question
Answered: 1 week ago
Question
Answered: 1 week ago
Question
Answered: 1 week ago
Question
Answered: 1 week ago
Question
Answered: 1 week ago
Question
Answered: 1 week ago
Question
Answered: 1 week ago
Question
Answered: 1 week ago
Question
Answered: 1 week ago
Question
Answered: 1 week ago
Question
Answered: 1 week ago
Question
Answered: 1 week ago
Question
Answered: 1 week ago
Question
Answered: 1 week ago
Question
Answered: 1 week ago
View Answer in SolutionInn App


