84 The following two-way table gives data for a 2 * 3 factorial experiment with two observations...
Question:
84 The following two-way table gives data for a 2 * 3 factorial experiment with two observations for each factor–level combination. The data are saved in the LM10_84 file
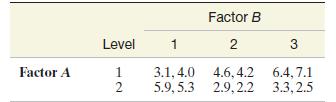
a. Identify the treatments for this experiment. Calculate and plot the treatment means, using the response variable as the y -axis and the levels of factor B as the x -axis.
Use the levels of factor A as plotting symbols. Do the treatment means appear to differ? Do the factors appear to interact?
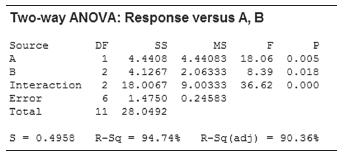
b. The MINITAB ANOVA printout for this experiment is shown below. Test to determine whether the treatment means differ at the a = .05 level of significance.
Does the test support your visual interpretation from part a ?
c. Does the result of the test in part b warrant a test for interaction between the two factors? If so, perform it, using a = .05.
d. Do the results of the previous tests warrant tests of the two factor main effects? If so, perform them, using a = .05.
e. Interpret the results of the tests. Do they support your visual interpretation from part a ?
Step by Step Answer:

This question has not been answered yet.
You can Ask your question!