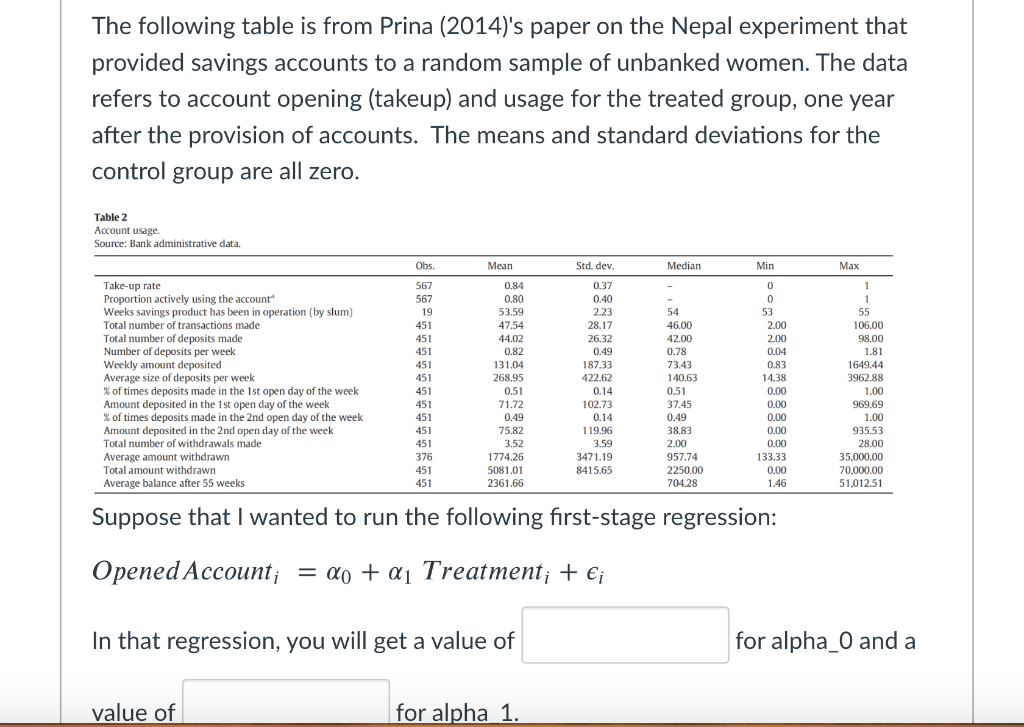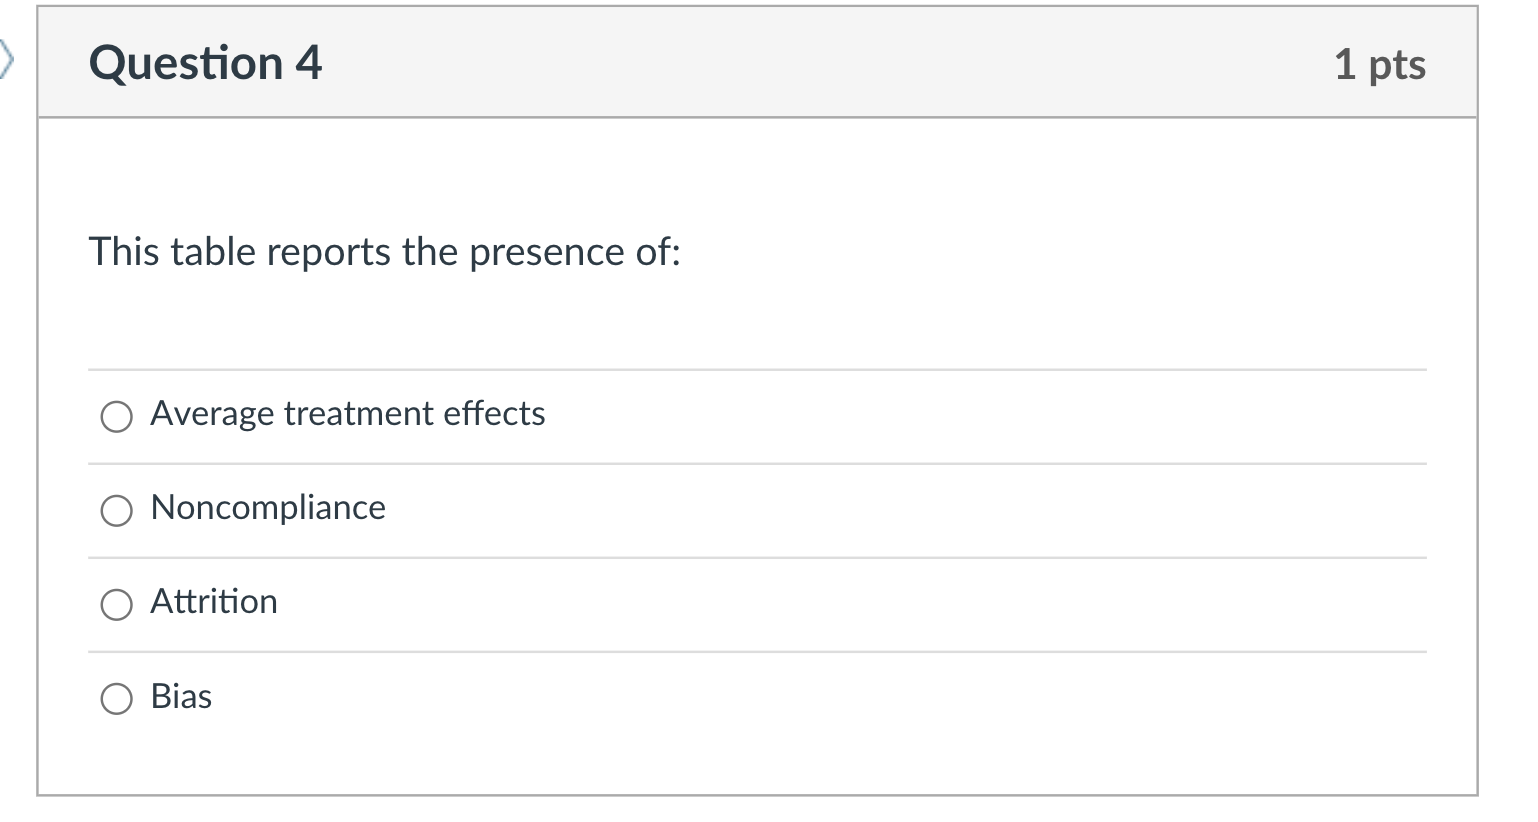


The following table is from Prina (2014)'s paper on the Nepal experiment that provided savings accounts to a random sample of unbanked women. The data refers to account opening (takeup) and usage for the treated group, one year after the provision of accounts. The means and standard deviations for the control group are all zero. Table 2 Account usage Source: Bank administrative data. Mean Std. dev. Median Min Max - Take-up rate Proportion actively using the account Weeks savings product has been in operation (by slum) Total number of transactions made Total number of deposits made Number of deposits per week Weekly amount deposited Average size of deposits per week % of times deposits made in the 1st open day of the week Amount deposited in the 1st open day of the week % of times deposits made in the 2nd open day of the week Amount deposited in the 2nd open day of the week Total number of withdrawals made Average amount withdrawn Total amount withdrawn Average balance after 55 weeks Obs. 567 567 19 451 451 451 451 451 451 451 451 451 451 376 451 451 0.84 0.80 53.59 47.54 44.02 0.82 131.04 268.95 0.51 71.72 0.49 75.82 3.52 1774.26 5081.01 2361.66 0.37 0.40 2.23 28.17 26.32 0.49 187,33 422.62 0.14 102.73 0.14 119.96 3.59 3471.19 8415,65 54 46.00 42.00 0.78 73.43 140.63 0.51 37.45 0.49 38.83 2.00 957.74 2250.00 704.28 0 0 0 53 2.00 2.00 0.04 0.83 14.38 0.00 0.00 0.00 0.00 0.00 133.33 0.00 1.46 1 1 55 106.00 98.00 1.81 1649.44 3962.88 1.00 969.69 1.00 935.53 28.00 35,000.00 70,000.00 51,012.51 Suppose that I wanted to run the following first-stage regression: Opened Account; = do + aj Treatment; + ; In that regression, you will get a value of for alpha_0 and a value of for alpha 1. Question 4 1 pts This table reports the presence of: O Average treatment effects O Noncompliance Attrition Bias Explain the different problems and solutions around schooling that demand siders and supply siders advocate. Provide at least two examples of supply side interventions and two examples of demand side interventions. For each, describe what the empirical evidence suggests about their effectiveness in increasing schooling. Your answer should be at least two paragraphs long. The following table is from Prina (2014)'s paper on the Nepal experiment that provided savings accounts to a random sample of unbanked women. The data refers to account opening (takeup) and usage for the treated group, one year after the provision of accounts. The means and standard deviations for the control group are all zero. Table 2 Account usage Source: Bank administrative data. Mean Std. dev. Median Min Max - Take-up rate Proportion actively using the account Weeks savings product has been in operation (by slum) Total number of transactions made Total number of deposits made Number of deposits per week Weekly amount deposited Average size of deposits per week % of times deposits made in the 1st open day of the week Amount deposited in the 1st open day of the week % of times deposits made in the 2nd open day of the week Amount deposited in the 2nd open day of the week Total number of withdrawals made Average amount withdrawn Total amount withdrawn Average balance after 55 weeks Obs. 567 567 19 451 451 451 451 451 451 451 451 451 451 376 451 451 0.84 0.80 53.59 47.54 44.02 0.82 131.04 268.95 0.51 71.72 0.49 75.82 3.52 1774.26 5081.01 2361.66 0.37 0.40 2.23 28.17 26.32 0.49 187,33 422.62 0.14 102.73 0.14 119.96 3.59 3471.19 8415,65 54 46.00 42.00 0.78 73.43 140.63 0.51 37.45 0.49 38.83 2.00 957.74 2250.00 704.28 0 0 0 53 2.00 2.00 0.04 0.83 14.38 0.00 0.00 0.00 0.00 0.00 133.33 0.00 1.46 1 1 55 106.00 98.00 1.81 1649.44 3962.88 1.00 969.69 1.00 935.53 28.00 35,000.00 70,000.00 51,012.51 Suppose that I wanted to run the following first-stage regression: Opened Account; = do + aj Treatment; + ; In that regression, you will get a value of for alpha_0 and a value of for alpha 1. Question 4 1 pts This table reports the presence of: O Average treatment effects O Noncompliance Attrition Bias Explain the different problems and solutions around schooling that demand siders and supply siders advocate. Provide at least two examples of supply side interventions and two examples of demand side interventions. For each, describe what the empirical evidence suggests about their effectiveness in increasing schooling. Your answer should be at least two paragraphs long


