Answered step by step
Verified Expert Solution
Question
1 Approved Answer
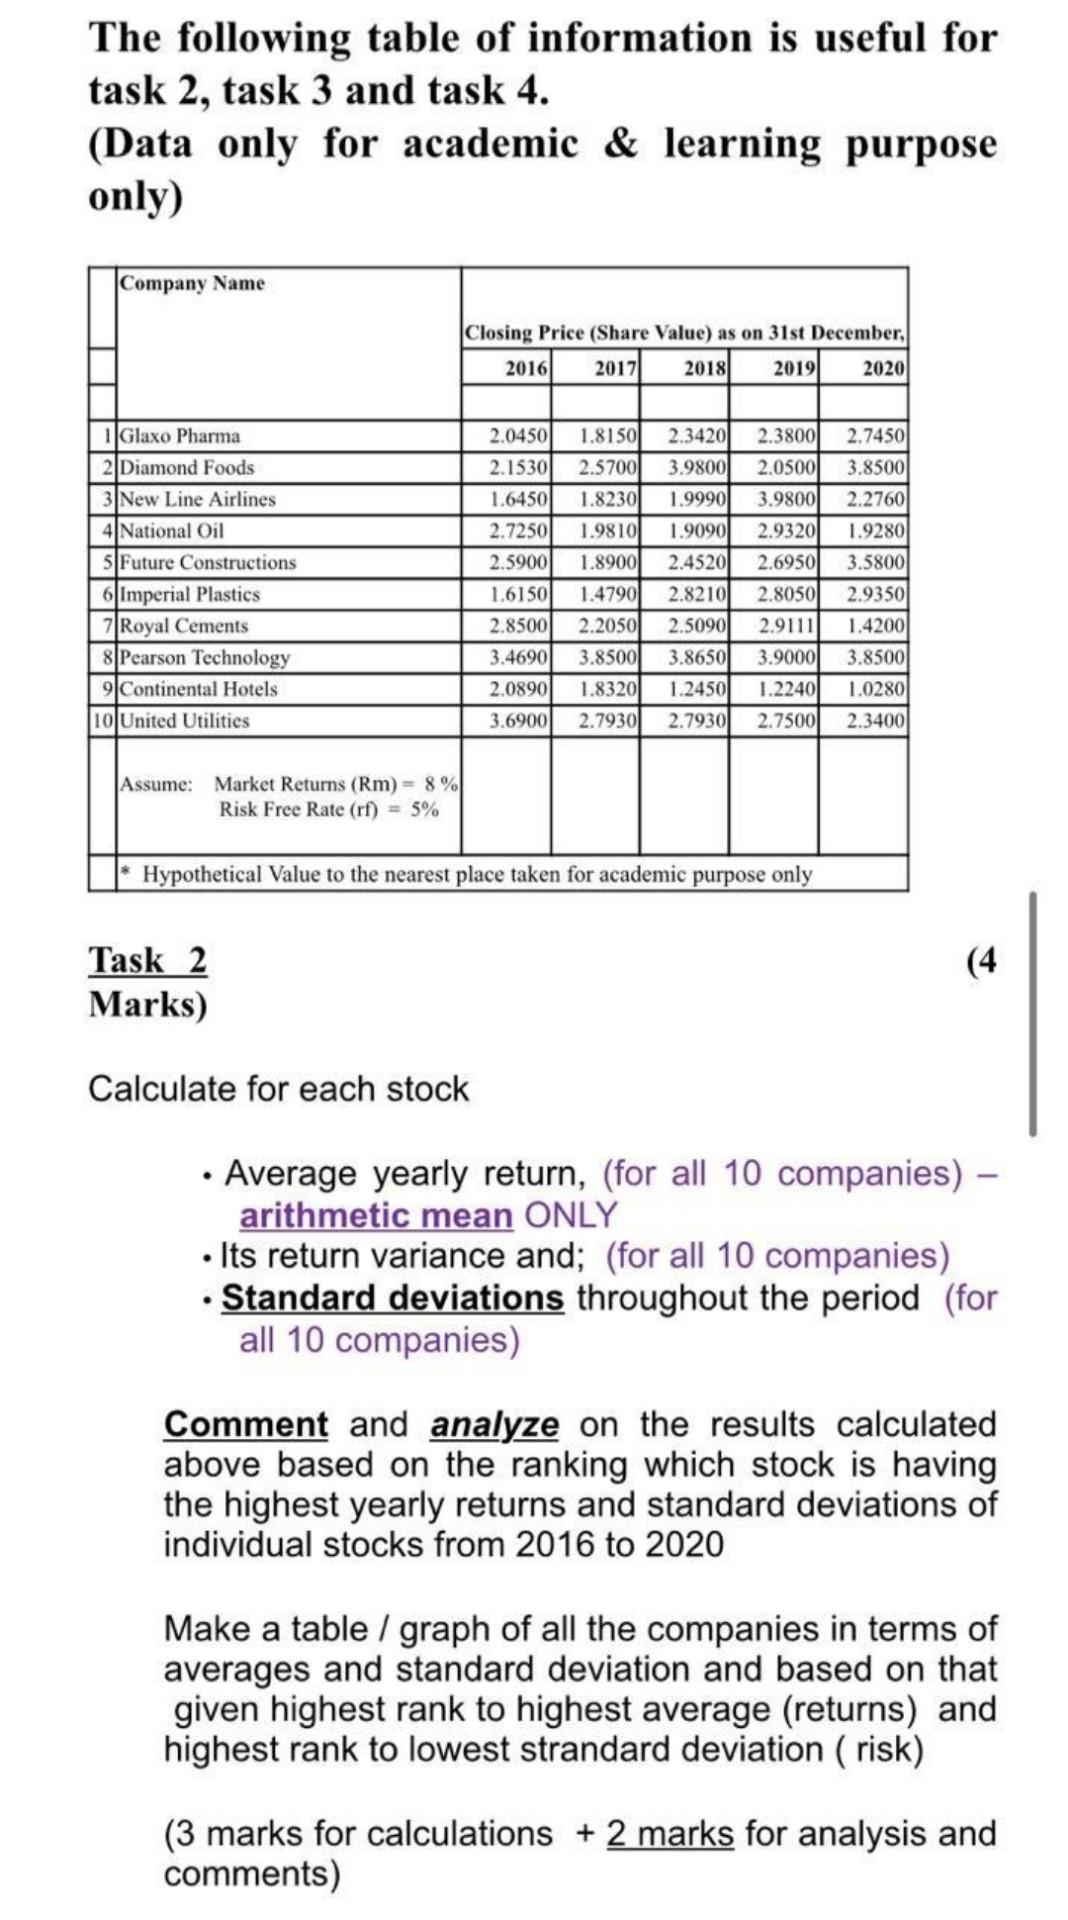
The following table of information is useful for task 2, task 3 and task 4. (Data only for academic & learning purpose only) Company Name


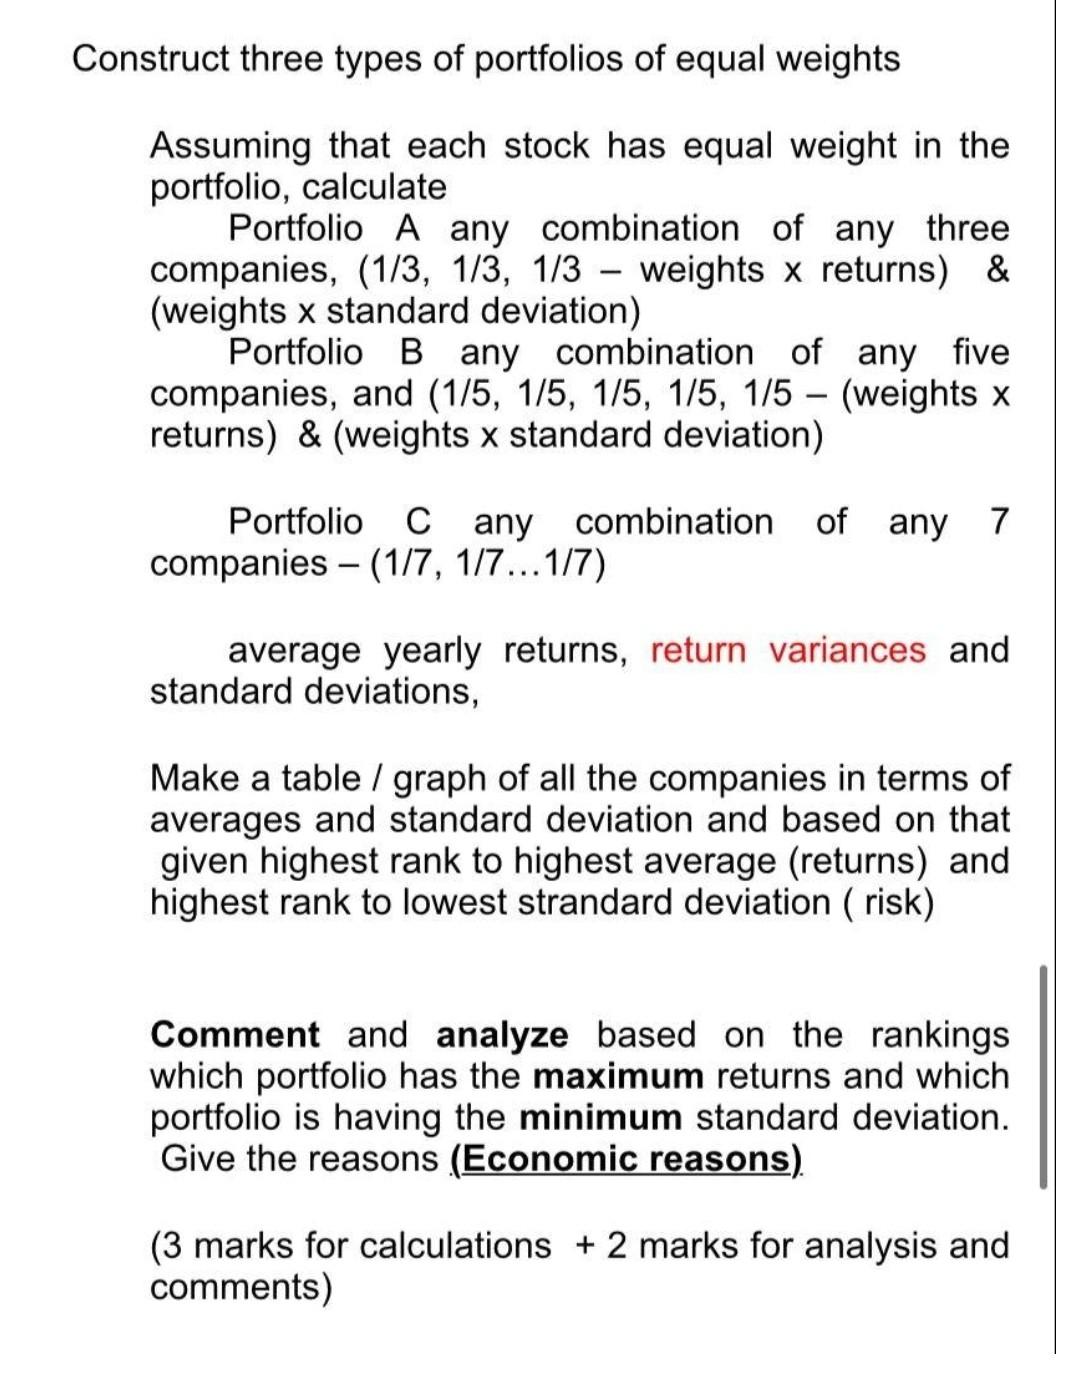
The following table of information is useful for task 2, task 3 and task 4. (Data only for academic & learning purpose only) Company Name Closing Price (Share Value) as on 31st December, 2016 20171 2018 20191 2020 2.3800 1 Glaxo Pharma 2 Diamond Foods 3 New Line Airlines 4 National Oil 5 Future Constructions 6 Imperial Plastics 7 Royal Cements 8|Pearson Technology 9 Continental Hotels 10 United Utilities 2.0450 2.1530 1.64501 2.72501 2.59001 1.6150 2.85001 3.46901 2.08901 3.69001 1.81501 2.5700 1.82301 1.9810 1.89001 1.4790 2.2050 3.85001 1.8320 2.7930 2.3420 3.9800 1.9990 1.9090 2.4520 2.8210 2.5090 3.8650 1.2450 2.7930 2.0500 3.9800 2.9320 2.6950 2.8050 2.9111 3.9000 1.2240 2.7500 2.7450 3.8500 2.27601 1.9280 3.58001 2.9350 1.4200 3.85001 1.0280 2.3400 Assume: Market Returns (Rm) = 8 % Risk Free Rate (rf) = 5% Hypothetical Value to the earest place taken for academic purpose only (4 Task 2 Marks) Calculate for each stock Average yearly return, (for all 10 companies) - arithmetic mean ONLY Its return variance and; (for all 10 companies) Standard deviations throughout the period (for all 10 companies) Comment and analyze on the results calculated above based on the ranking which stock is having the highest yearly returns and standard deviations of individual stocks from 2016 to 2020 Make a table / graph of all the companies in terms of averages and standard deviation and based on that given highest rank to highest average (returns) and highest rank to lowest strandard deviation ( risk) (3 marks for calculations + 2 marks for analysis and comments) Construct three types of portfolios of equal weights Assuming that each stock has equal weight in the portfolio, calculate Portfolio A any combination of any three companies, (1/3, 1/3, 1/3 - weights x returns) & (weights x standard deviation) Portfolio B any combination of any five companies, and (1/5, 1/5, 1/5, 1/5, 1/5 - (weights x returns) & (weights x standard deviation) Portfolio C any combination of any 7 companies -(1/7, 1/7...1/7) average yearly returns, return variances and standard deviations, Make a table / graph of all the companies in terms of averages and standard deviation and based on that given highest rank to highest average (returns) and highest rank to lowest strandard deviation ( risk) Comment and analyze based on the rankings which portfolio has the maximum returns and which portfolio is having the minimum standard deviation. Give the reasons (Economic reasons). (3 marks for calculations + 2 marks for analysis and comments)
Step by Step Solution
There are 3 Steps involved in it
Step: 1

Get Instant Access to Expert-Tailored Solutions
See step-by-step solutions with expert insights and AI powered tools for academic success
Step: 2

Step: 3

Ace Your Homework with AI
Get the answers you need in no time with our AI-driven, step-by-step assistance
Get Started


