

Answered step by step
Verified Expert Solution
Question
1 Approved Answer
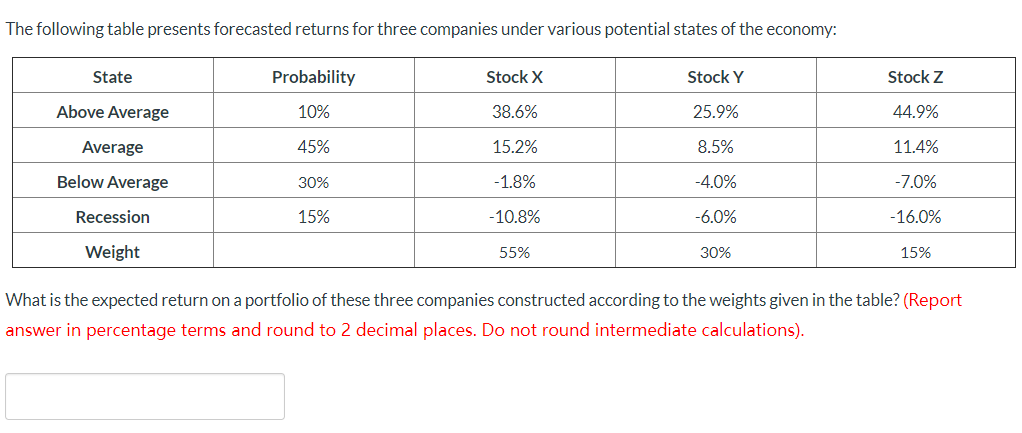
The following table presents forecasted returns for three companies under various potential states of the economy: State Probability Stock x Stock Y Stock Z Above
Step by Step Solution
There are 3 Steps involved in it
Step: 1

Get Instant Access to Expert-Tailored Solutions
See step-by-step solutions with expert insights and AI powered tools for academic success
Step: 2

Step: 3
Ace Your Homework with AI
Get the answers you need in no time with our AI-driven, step-by-step assistance
Get Started
Marketing For Financial Advisors
Authors: Eric Bradlow, Keith Niedermeier, Patti Williams
1st Edition
0071605142, 978-0071605144