Answered step by step
Verified Expert Solution
Question
1 Approved Answer
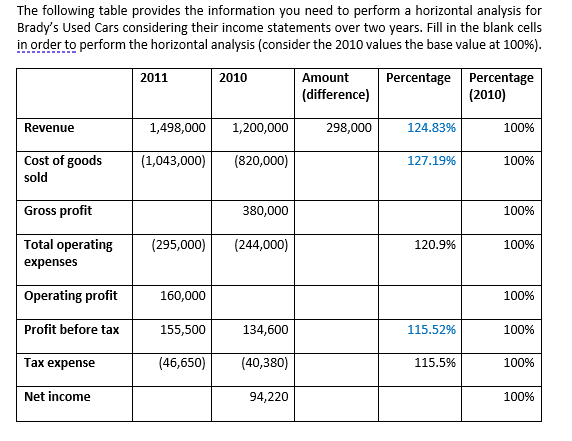
The following table provides the information you need to perform a horizontal analysis for Brady's Used Cars considering their income statements over two years. Fill

The following table provides the information you need to perform a horizontal analysis for Brady's Used Cars considering their income statements over two years. Fill in the blank cells in order to perform the horizontal analysis (consider the 2010 values the base value at 100%). 2011 2010 Amount (difference) Percentage Percentage (2010) Revenue 1,498,000 1,200,000 298,000 124.839 100% (1,043,000) Cost of goods sold (820,000) 127.1996 100% Gross profit 380,000 100% (295,000) Total operating expenses (244,000) 120.9% 100% Operating profit 160,000 100% Profit before tax 155,500 134,600 115.5296 100% Tax expense (46,650) (40,380) 115.5% 100% Net income 94,220 100%
Step by Step Solution
There are 3 Steps involved in it
Step: 1

Get Instant Access to Expert-Tailored Solutions
See step-by-step solutions with expert insights and AI powered tools for academic success
Step: 2

Step: 3

Ace Your Homework with AI
Get the answers you need in no time with our AI-driven, step-by-step assistance
Get Started


