

Answered step by step
Verified Expert Solution
Question
1 Approved Answer
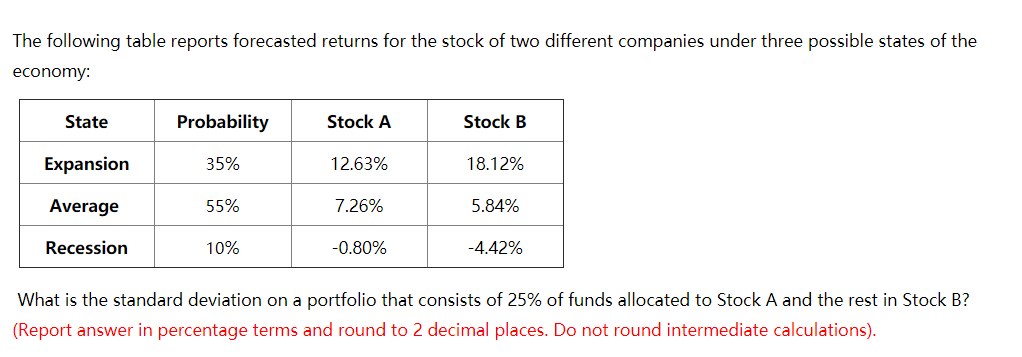
The following table reports forecasted returns for the stock of two different companies under three possible states of the economy: State Probability Stock A Stock
Step by Step Solution
There are 3 Steps involved in it
Step: 1

Get Instant Access to Expert-Tailored Solutions
See step-by-step solutions with expert insights and AI powered tools for academic success
Step: 2

Step: 3
Ace Your Homework with AI
Get the answers you need in no time with our AI-driven, step-by-step assistance
Get Started
Ebay Tips And Tricks To Increase Your Ebay Sales
Authors: Jessica Wilson
1st Edition
1774854015, 978-1774854013