Answered step by step
Verified Expert Solution
Question
1 Approved Answer
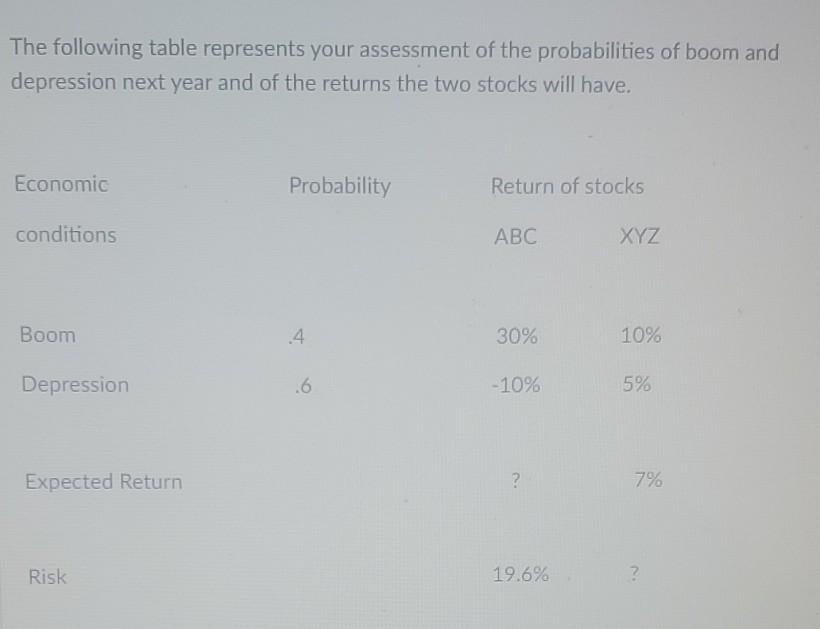
The following table represents your assessment of the probabilities of boom and depression next year and of the returns the two stocks will have. Economic


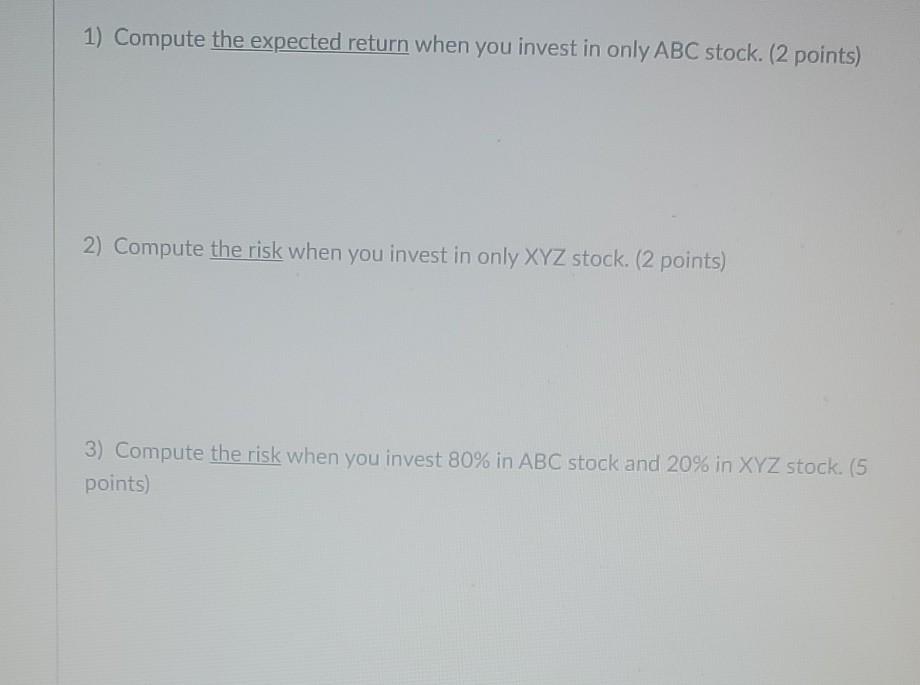
The following table represents your assessment of the probabilities of boom and depression next year and of the returns the two stocks will have. Economic Probability Return of stocks conditions ABC XYZ Boom 4 30% 10% Depression 16 -10% 5% Expected Return ? 7% Risk 19.6% ? 1) Compute the expected return when you invest in only ABC stock. (2 points) 2) Compute the risk when you invest in only XYZ stock. (2 points) 3) Compute the risk when you invest 80% in ABC stock and 20% in XYZ stock. (5 points)
Step by Step Solution
There are 3 Steps involved in it
Step: 1

Get Instant Access to Expert-Tailored Solutions
See step-by-step solutions with expert insights and AI powered tools for academic success
Step: 2

Step: 3

Ace Your Homework with AI
Get the answers you need in no time with our AI-driven, step-by-step assistance
Get Started


