

Answered step by step
Verified Expert Solution
Question
1 Approved Answer
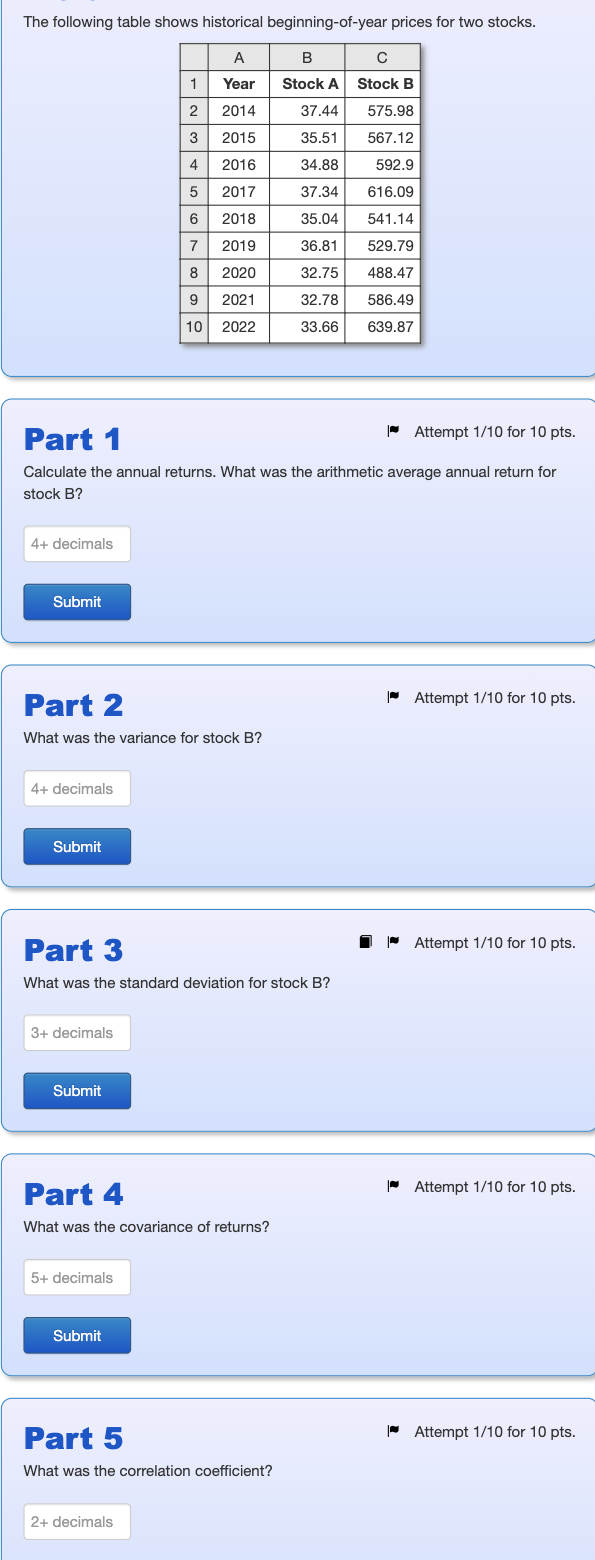
The following table shows historical beginning-of-year prices for two stocks. A 1 Year 2 2014 3 2015 4 2016 5 2017 6 2018 7 2019
Step by Step Solution
There are 3 Steps involved in it
Step: 1

Get Instant Access to Expert-Tailored Solutions
See step-by-step solutions with expert insights and AI powered tools for academic success
Step: 2

Step: 3
Ace Your Homework with AI
Get the answers you need in no time with our AI-driven, step-by-step assistance
Get Started
Handbook Of Financial Planning And Control
Authors: Robert P. Greenwood
3rd Edition
0566083728, 978-0566083723