Answered step by step
Verified Expert Solution
Link Copied!

Question

1 Approved Answer

The following table shows the annual average data on the employment status of the U.S. civilian noninstitutional population by age in 2018. Employed Unemployed Not
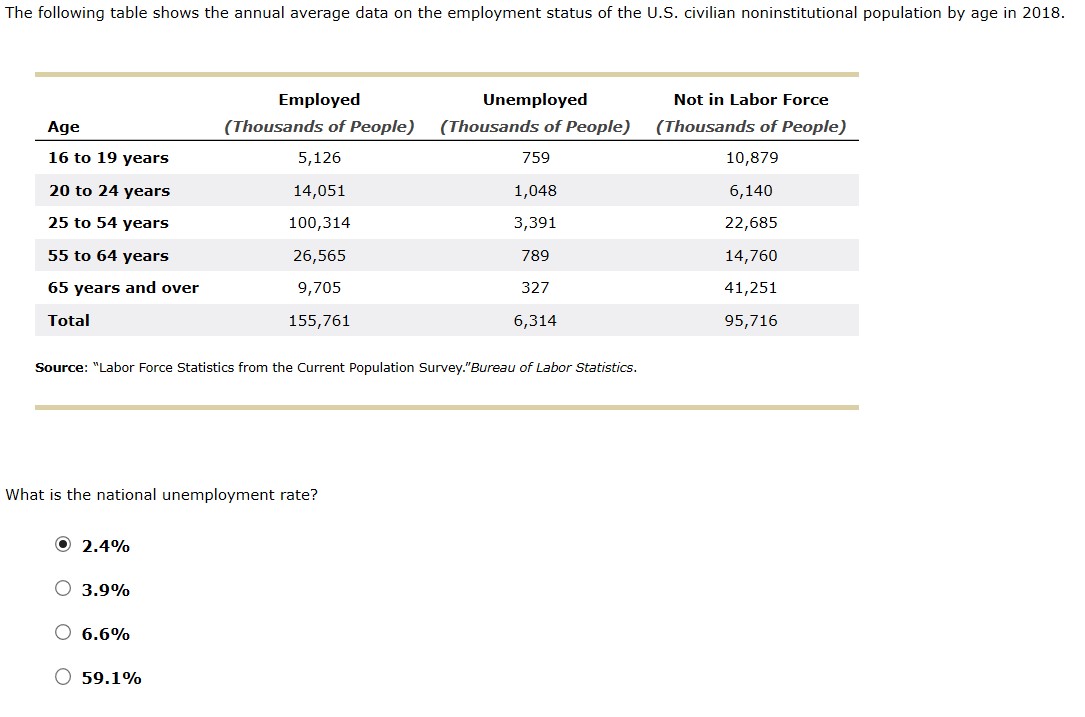
image text in transcribed
The following table shows the annual average data on the employment status of the U.S. civilian noninstitutional population by age in 2018. Employed Unemployed Not in Labor Force Age ( Thousands of People) ( Thousands of People) { Thousands of People) 16 to 19 years 5,126 759 10,3?9 20 to 24 years 14,051 1,048 6,140 25 to 54 years 100,314 3,391 22,685 55 to 64 years 26,565 ?89 14,?60 65 years and over 9,?05 32? 41,251 Total 155,?61 6,314 95,?16 Source: \"Labor Force Statistics from the Current Population Survey."Bureau of Labor Statistics. What is the national unemployment rate? (9 2.4% O 3.9% O 6.6% O 59.1%

Step by Step Solution

There are 3 Steps involved in it

Step: 1

blur-text-image

Get Instant Access to Expert-Tailored Solutions

See step-by-step solutions with expert insights and AI powered tools for academic success

Step: 2

blur-text-image

Step: 3

blur-text-image

Ace Your Homework with AI

Get the answers you need in no time with our AI-driven, step-by-step assistance

Get Started

Recommended Textbook for

Econometric Analysis

Authors: William H. Greene

5th Edition

130661899, 978-0130661890

More Books

Students also viewed these Economics questions

Question

| In what ways am 1 striving to make their lives better?

Answered: 1 week ago

Question

LO2.2 List the main characteristics of the market system.

Answered: 1 week ago