

Question
The following table shows the annual realized returns on the following US securi- ties from 1997 to 2016: the stock market (S&P 500), corporate bonds,
The following table shows the annual realized returns on the following US securi- ties from 1997 to 2016: the stock market (S&P 500), corporate bonds, government bonds, and Treasury bills.
a. Theory suggests that the riskier the investment, the higher the expected return. Discuss the extent to which this is illustrated by the data in the table.
b. How would you explain the relatively high volatility in the annual returns on both corporate and government long term bonds?
c. What was the market risk premium of the S&P 500 for each of the years from 1997 to 2016? What was it over the two periods 1997 2012 and 1926 -2016, using averages? What conclusions can you draw?
here is something to help: https://www.chegg.com/homework-help/questions-and-answers/441-chapter-12-estimating-cost-capital-treasury-bills-corporate-bonds-rate-government-time-q38127619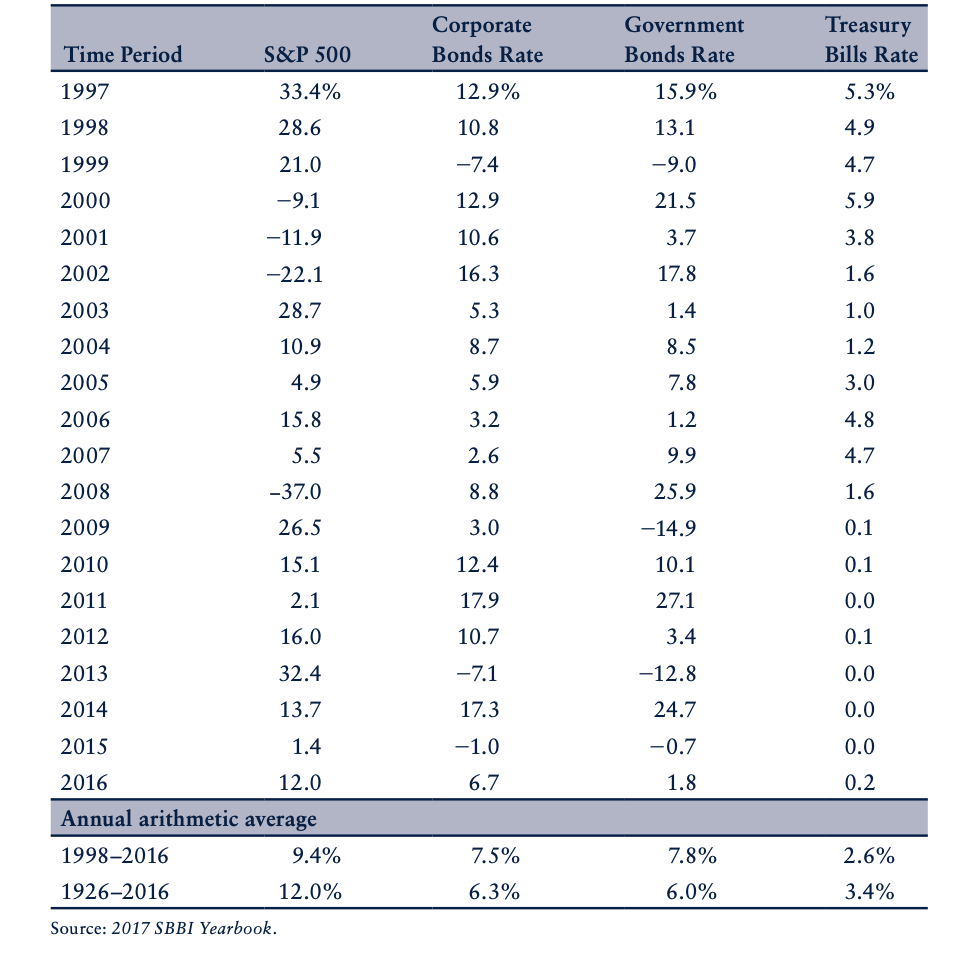
Step by Step Solution
There are 3 Steps involved in it
Step: 1

Get Instant Access to Expert-Tailored Solutions
See step-by-step solutions with expert insights and AI powered tools for academic success
Step: 2

Step: 3
Ace Your Homework with AI
Get the answers you need in no time with our AI-driven, step-by-step assistance
Get Started
Personal Finance In A Public World How Technology Social Media And Ads Affect Your Money Decisions
Authors: Bob DePasquale
1st Edition
1637306652, 978-1637306659