Question
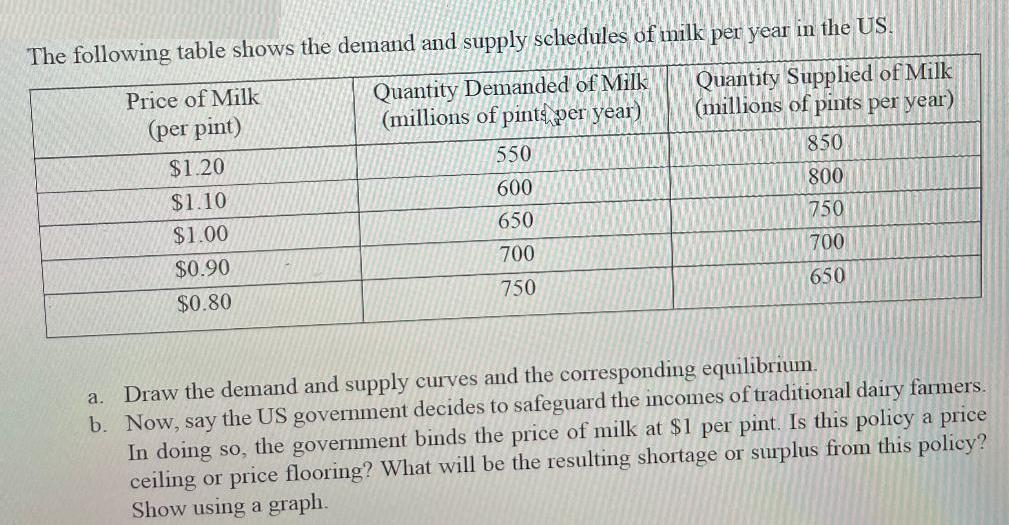
The following table shows the demand and supply schedules of milk per year in the US. Quantity Demanded of Milk (millions of pints per

The following table shows the demand and supply schedules of milk per year in the US. Quantity Demanded of Milk (millions of pints per year) Quantity Supplied of Milk (millions of pints per year) Price of Milk (per pint) $1.20 550 850 $1.10 600 800 $1.00 650 750 $0.90 700 700 $0.80 750 650 Draw the demand and supply curves and the corresponding equilibrium. b. Now, say the US government decides to safeguard the incomes of traditional dairy farmers. In doing so, the government binds the price of milk at $1 per pint. Is this policy a price ceiling or price flooring? What will be the resulting shortage or surplus from this policy? Show using a graph. a.
Step by Step Solution
3.40 Rating (166 Votes )
There are 3 Steps involved in it
Step: 1
equilbrum pruc at a prici 16 the prue Is equal to ouan tet...
Get Instant Access to Expert-Tailored Solutions
See step-by-step solutions with expert insights and AI powered tools for academic success
Step: 2

Step: 3

Ace Your Homework with AI
Get the answers you need in no time with our AI-driven, step-by-step assistance
Get StartedRecommended Textbook for
Microeconomics
Authors: Paul Krugman, Robin Wells
3rd edition
978-1429283427, 1429283424, 978-1464104213, 1464104212, 978-1429283434
Students also viewed these Economics questions
Question
Answered: 1 week ago
Question
Answered: 1 week ago
Question
Answered: 1 week ago
Question
Answered: 1 week ago
Question
Answered: 1 week ago
Question
Answered: 1 week ago
Question
Answered: 1 week ago
Question
Answered: 1 week ago
Question
Answered: 1 week ago
Question
Answered: 1 week ago
Question
Answered: 1 week ago
Question
Answered: 1 week ago
Question
Answered: 1 week ago
Question
Answered: 1 week ago
Question
Answered: 1 week ago
Question
Answered: 1 week ago
Question
Answered: 1 week ago
Question
Answered: 1 week ago
Question
Answered: 1 week ago
Question
Answered: 1 week ago
Question
Answered: 1 week ago
Question
Answered: 1 week ago
View Answer in SolutionInn App


