Answered step by step
Verified Expert Solution
Link Copied!

Question

1 Approved Answer

The following table shows the grip strength of women compared to their age. Using the given data, create a scatterplot and choose the best trendline
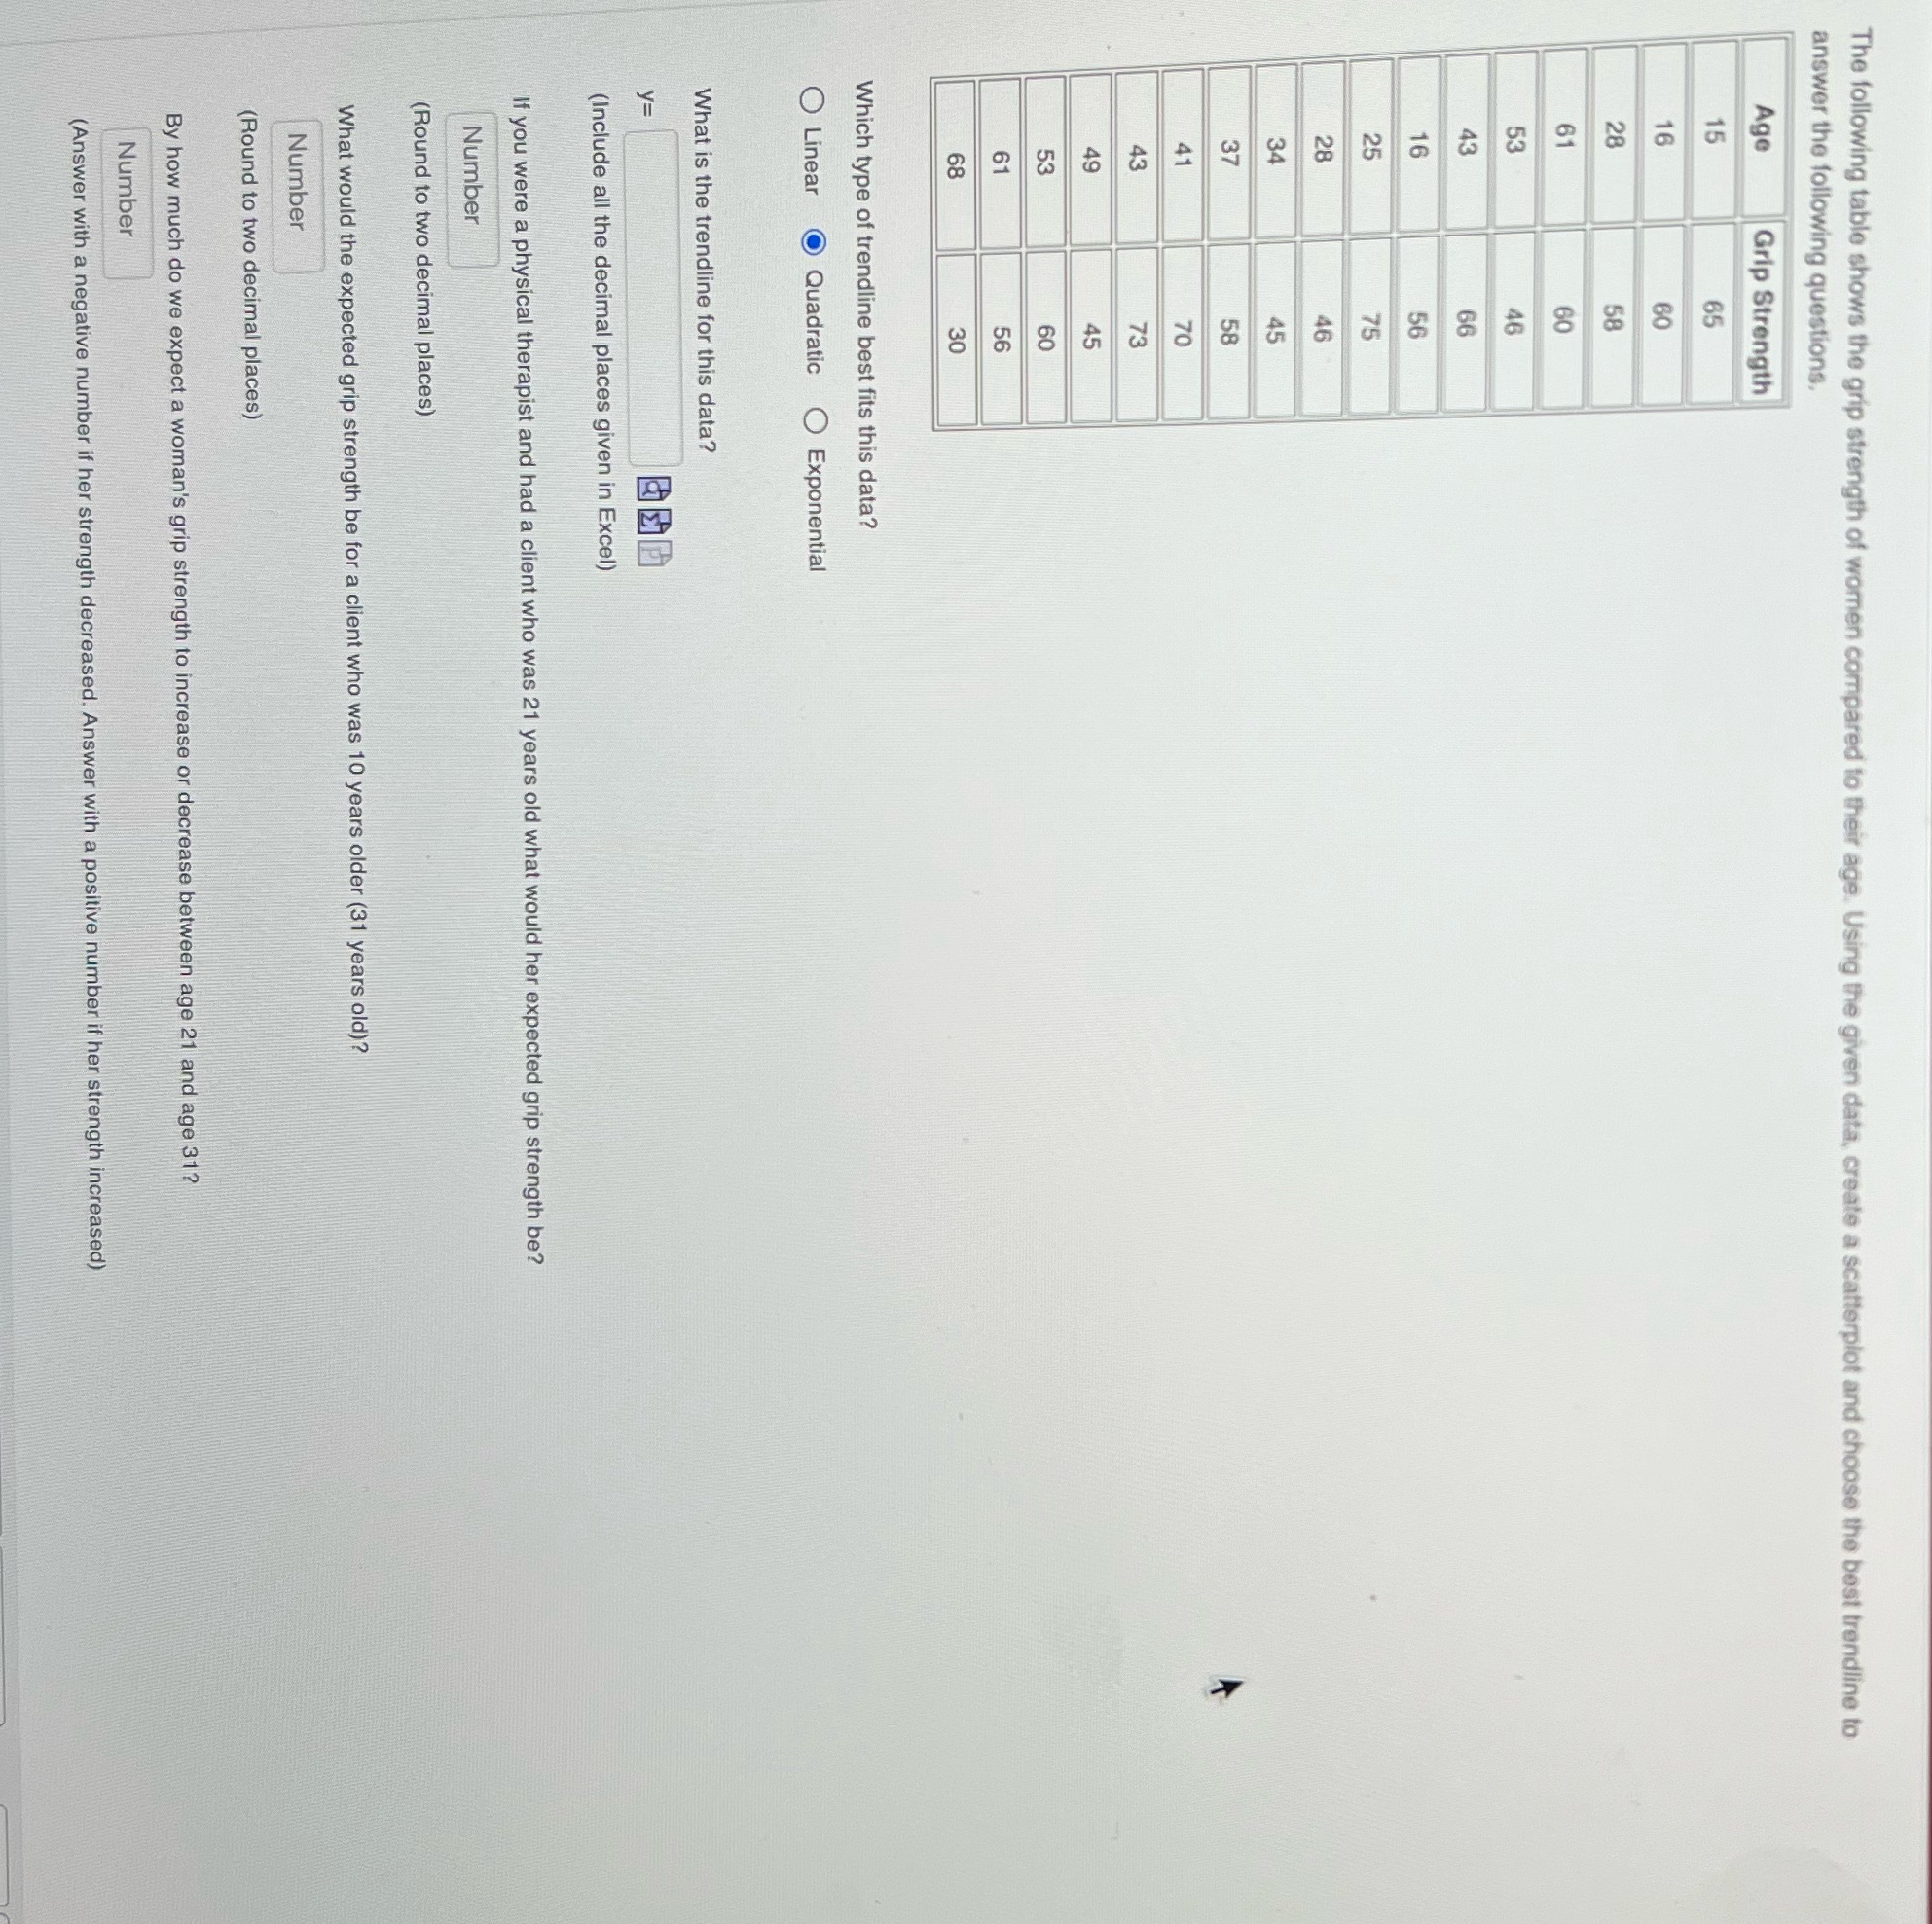
image text in transcribed
The following table shows the grip strength of women compared to their age. Using the given data, create a scatterplot and choose the best trendline to answer the following questions, Age Grip Strength 8 8 Which type of trendline best fits this data ? Linear Quadratic Exponential What is the trendline for this data? y= (Include all the decimal places given in Excel) If you were a physical therapist and had a client who was 21 years old what would her expected grip strength be ? Number (Round to two decimal places) What would the expected grip strength be for a client who was 10 years older (31 years old) ? Number (Round to two decimal places) By how much do we expect a woman's grip strength to increase or decrease between age 21 and age 31? Number ( Answer with a negative number if her strength decreased. Answer with a positive number if her strength increased)

Step by Step Solution

There are 3 Steps involved in it

Step: 1

blur-text-image

Get Instant Access to Expert-Tailored Solutions

See step-by-step solutions with expert insights and AI powered tools for academic success

Step: 2

blur-text-image

Step: 3

blur-text-image

Ace Your Homework with AI

Get the answers you need in no time with our AI-driven, step-by-step assistance

Get Started

Recommended Textbook for

Probability and Random Processes With Applications to Signal Processing and Communications

Authors: Scott Miller, Donald Childers

2nd edition

123869811, 978-0121726515, 121726517, 978-0130200716, 978-0123869814

More Books

Students also viewed these Mathematics questions