Answered step by step
Verified Expert Solution
Link Copied!

Question

1 Approved Answer

The following table shows the relationship between your wealth (in thousands of dollars) and your utility Utility Wealth 5 10 15 20 25 30 11.0
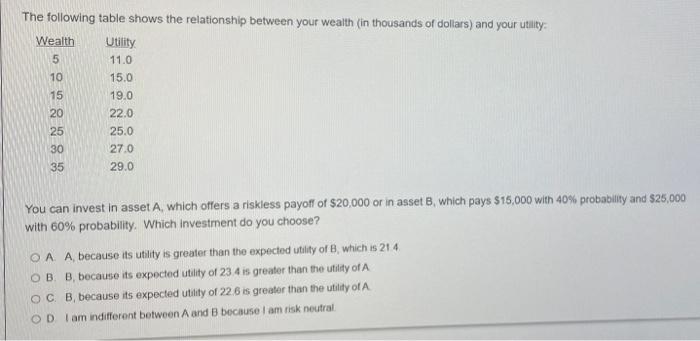
image text in transcribed
The following table shows the relationship between your wealth (in thousands of dollars) and your utility Utility Wealth 5 10 15 20 25 30 11.0 15.0 19.0 22.0 25.0 27.0 29.0 35 You can invest in asset A, which offers a riskless payoff of $20,000 or in asset B, which pays $15,000 with 40% probability and $25,000 with 60% probability. Which investment do you choose? OA A, because its utility is greater than the expected utility of B, which is 214 OB B, because its expected utility of 23 4 is greater than the utility of A OCB, because its expected utility of 226 is greater than the utility of A OD lam indifferent between A and B because I am risk neutral

Step by Step Solution

There are 3 Steps involved in it

Step: 1

blur-text-image

Get Instant Access to Expert-Tailored Solutions

See step-by-step solutions with expert insights and AI powered tools for academic success

Step: 2

blur-text-image_2

Step: 3

blur-text-image_3

Ace Your Homework with AI

Get the answers you need in no time with our AI-driven, step-by-step assistance

Get Started

Recommended Textbook for

Oregon Real Estate Practices Finance Law

Authors: Palmer, Frank

1st Edition

0324137710, 9780324137712

More Books

Students also viewed these Finance questions

Question

Matlab List of simulink projects for beginners.

Answered: 1 week ago