Answered step by step
Verified Expert Solution
Link Copied!

Question

1 Approved Answer

The following tables represent the automobile claims and losses data for two auto insurers, A and B. Use this data to compute the answer to
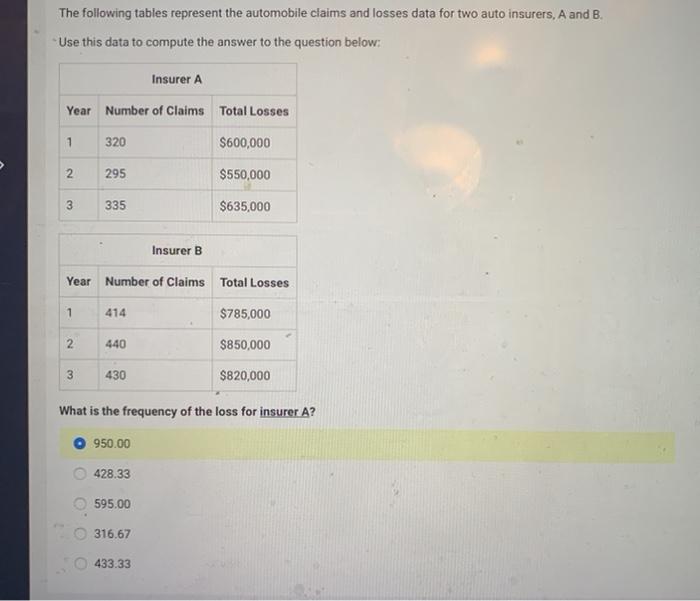
image text in transcribed
The following tables represent the automobile claims and losses data for two auto insurers, A and B. Use this data to compute the answer to the question below: Insurer A Year Number of Claims Total Losses 1 320 $600,000 295 $550,000 2 3 335 $635,000 Insurer B Year Number of Claims Total Losses 1 414 $785,000 2 440 $850,000 3 430 $820,000 What is the frequency of the loss for insurer A? 950.00 428.33 595.00 316.67 433.33

Step by Step Solution

There are 3 Steps involved in it

Step: 1

blur-text-image

Get Instant Access to Expert-Tailored Solutions

See step-by-step solutions with expert insights and AI powered tools for academic success

Step: 2

blur-text-image

Step: 3

blur-text-image

Ace Your Homework with AI

Get the answers you need in no time with our AI-driven, step-by-step assistance

Get Started

Recommended Textbook for

Credit Derivatives Handbook Global Perspectives Innovations And Market Drivers

Authors: Greg Gregoriou, Paul Ali

1st Edition

0071549528, 978-0071549523

More Books

Students also viewed these Finance questions