

Answered step by step
Verified Expert Solution
Question
1 Approved Answer
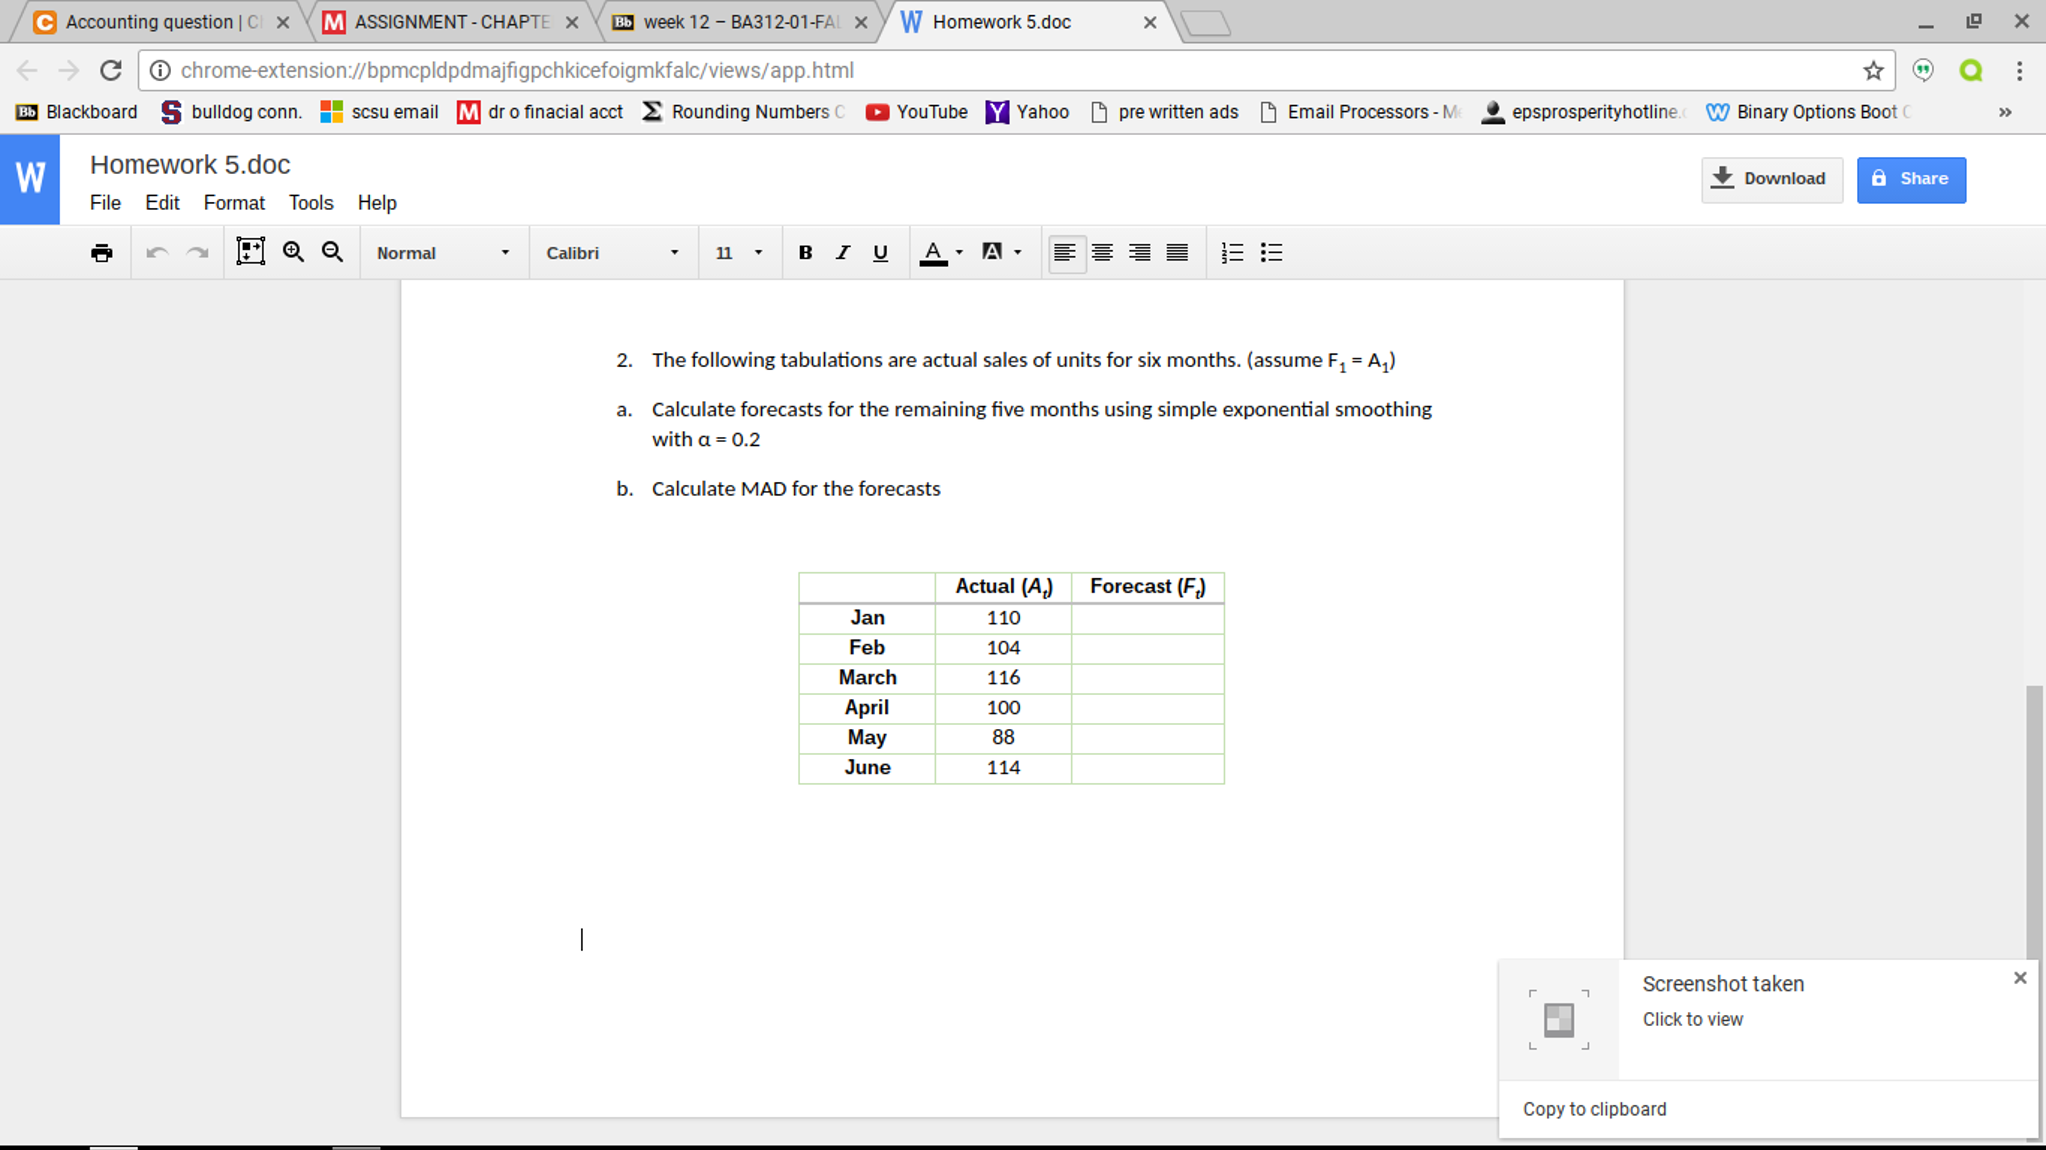
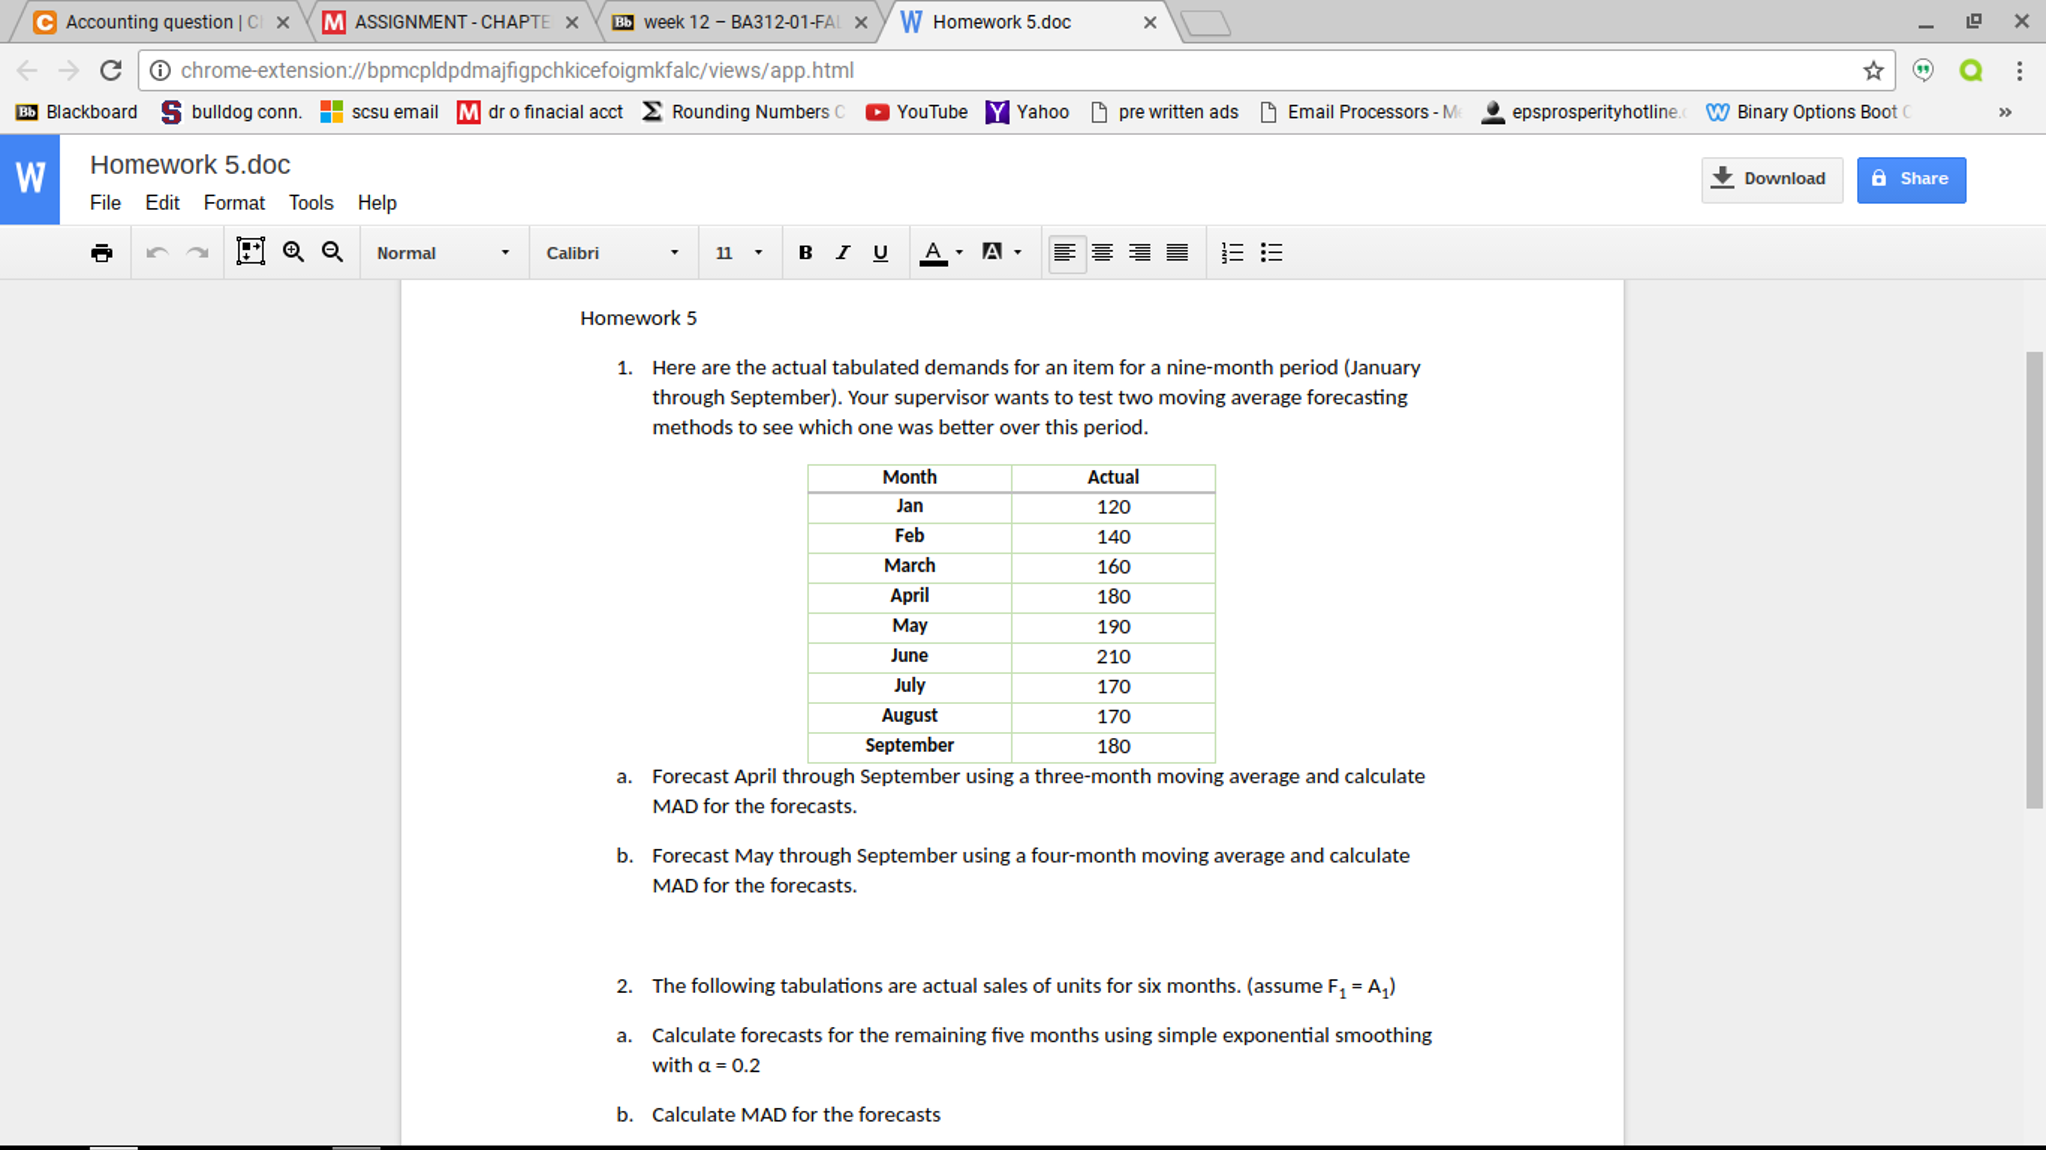
The following tabulations are actual sales of units for six months, (assume F_1 = A_1) Calculate forecasts for the remaining five months using simple exponential
Step by Step Solution
There are 3 Steps involved in it
Step: 1

Get Instant Access to Expert-Tailored Solutions
See step-by-step solutions with expert insights and AI powered tools for academic success
Step: 2

Step: 3
Ace Your Homework with AI
Get the answers you need in no time with our AI-driven, step-by-step assistance
Get Started
Transfer Pricing Audits In China
Authors: J. Li, A. Paisey
2007th Edition
0230001963, 978-0230001961