Answered step by step
Verified Expert Solution
Question
1 Approved Answer
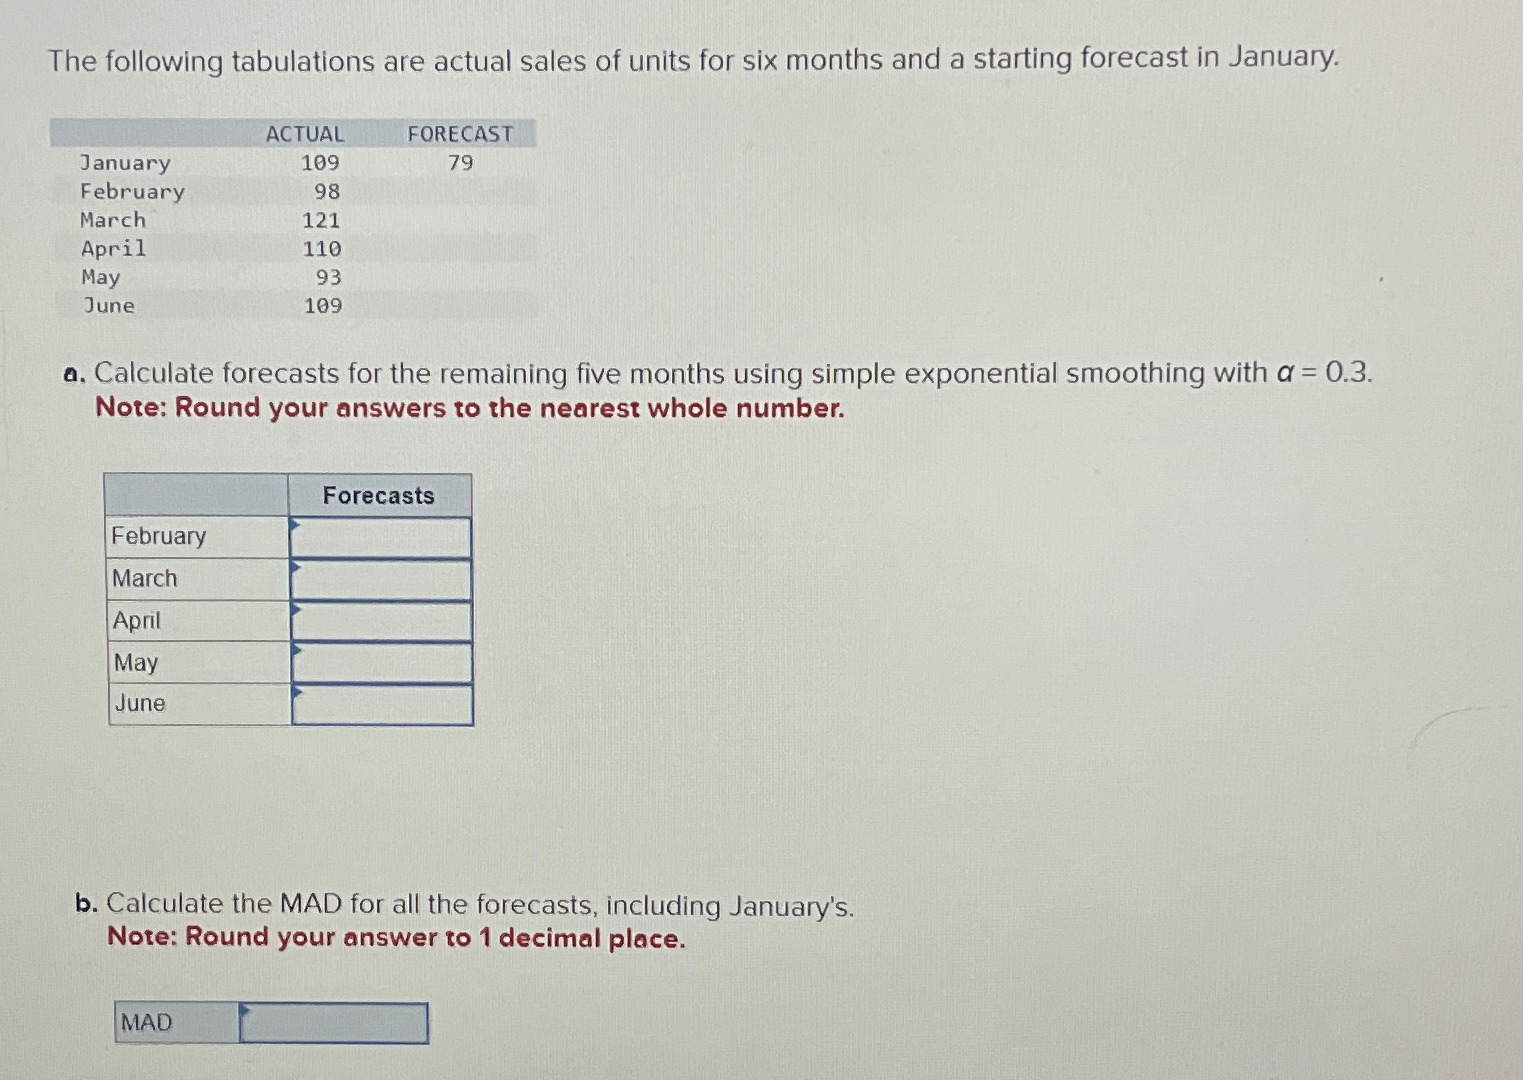
The following tabulations are actual sales of units for six months and a starting forecast in January. table [ [ , ACTUAL,FORECAST ] ,
The following tabulations are actual sales of units for six months and a starting forecast in January.
tableACTUAL,FORECASTJanuaryFebruaryMarchAprilMayJune
a Calculate forecasts for the remaining five months using simple exponential smoothing with Note: Round your answers to the nearest whole number.
tableForecastsFebruaryMarchAprilMayJune
b Calculate the MAD for all the forecasts, including January's.
Note: Round your answer to decimal place.
MAD

Step by Step Solution
There are 3 Steps involved in it
Step: 1

Get Instant Access to Expert-Tailored Solutions
See step-by-step solutions with expert insights and AI powered tools for academic success
Step: 2

Step: 3

Ace Your Homework with AI
Get the answers you need in no time with our AI-driven, step-by-step assistance
Get Started


