

Question
The following two confusion matrices represent the performance of two different classifiers, C1 and C2, on the same validation dataset (which had 100 data points).
The following two confusion matrices represent the performance of two different classifiers, C1 and C2, on the same validation dataset (which had 100 data points). Both classifiers were built to predict whether the person is likely to buy a luxury car.
Compare the two classifiers based on their predictive accuracy as well as precision, recall, and F-measure (for class \Yes", i.e., for the purchase outcome). Show the calculation for each metric (i.e., dont just report which classifier has higher performance).
Also, compute the accuracy of the naive (majority) rule on this validation dataset.
Hint: you may want to first draw the confusion matrix that you would get with naive/majority rule, to help you with accuracy calculation.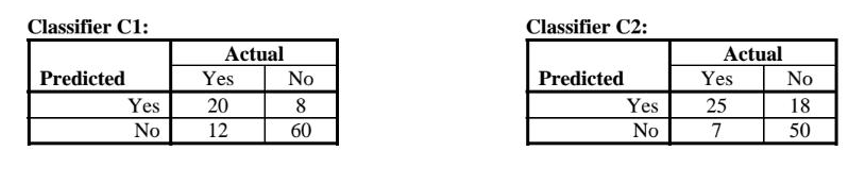
Step by Step Solution
There are 3 Steps involved in it
Step: 1

Get Instant Access to Expert-Tailored Solutions
See step-by-step solutions with expert insights and AI powered tools for academic success
Step: 2

Step: 3
Ace Your Homework with AI
Get the answers you need in no time with our AI-driven, step-by-step assistance
Get Started
An Audit Of The Case Study Method
Authors: Michael Masoner
1st Edition
027592761X, 978-0275927615