Answered step by step
Verified Expert Solution
Question
1 Approved Answer
the following two figures are part of the excel output sheet of a regression analysis to estimate the expected rate of return of two companies
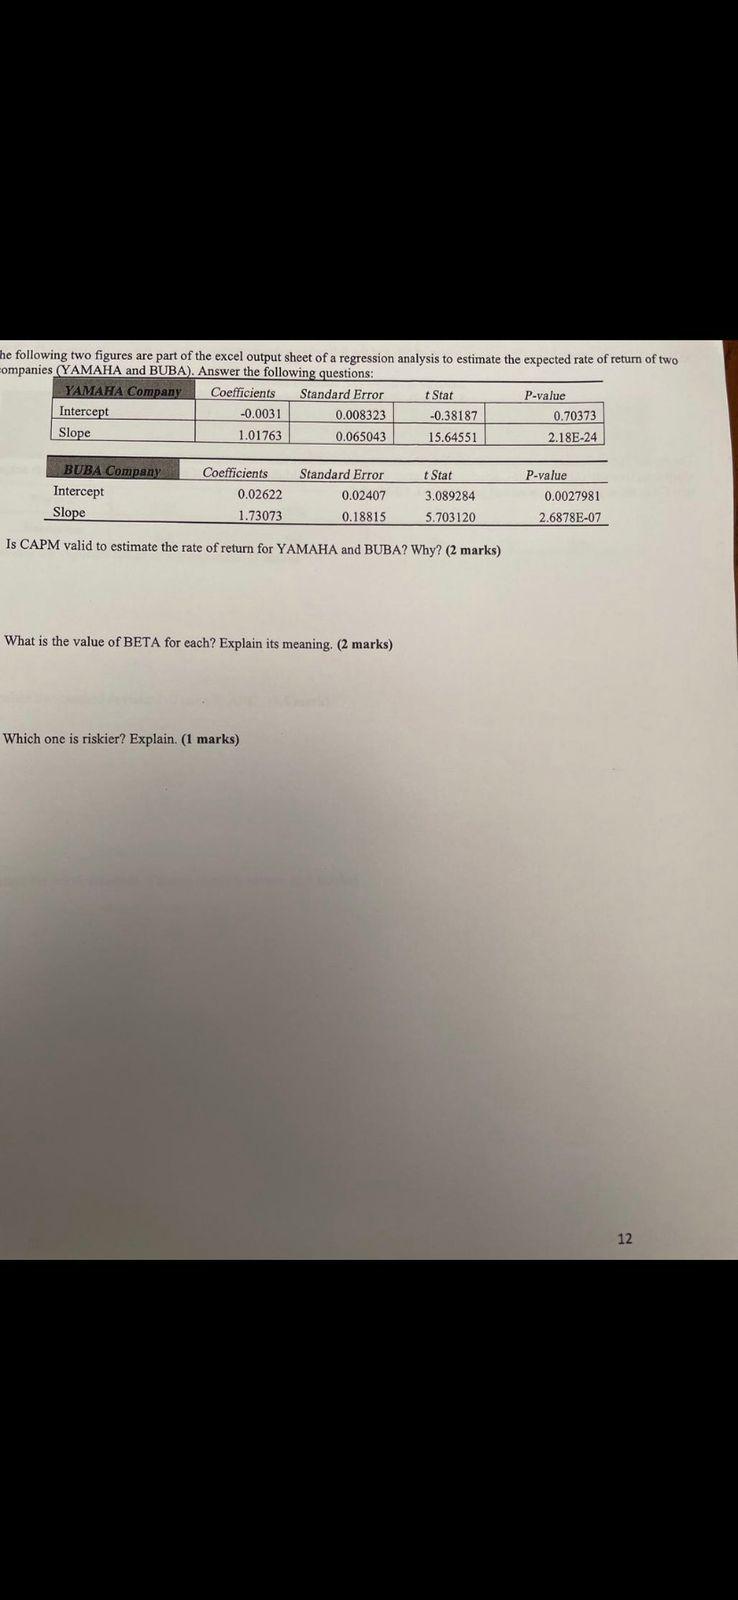
the following two figures are part of the excel output sheet of a regression analysis to estimate the expected rate of return of two companies (YAMAHA and BUBA). answer the following questions:
1. is CAPM valid to estimate the rate of return for YAMAHA and BUBA? why?
2. what is the beta for each? explain the meaning
3. which company is riskier and explain why?
4. what is alpha for each?
please explain each answer and please answer question number 4 as it is important but not shown in the image bellow

he following two figures are part of the excel output sheet of a regression analysis to estimate the expected rate of return of two companies (YAMAHA and BUBA). Answer the following questions: YAMAHA Company Coefficients t Stat P-value Intercept -0.0031 Standard Error 0.008323 0.065043 -0.38187 15.64551 0.70373 2.18E-24 Slope 1.01763 BUBA Company Coefficients Standard Error t Stat 0.02622 0.02407 3.089284 0.0027981 Intercept Slope 1.73073 0.18815 5.703120 2.6878E-07 Is CAPM valid to estimate the rate of return for YAMAHA and BUBA? Why? (2 marks) What is the value of BETA for each? Explain its meaning. (2 marks) Which one is riskier? Explain. (1 marks) P-value 12 he following two figures are part of the excel output sheet of a regression analysis to estimate the expected rate of return of two companies (YAMAHA and BUBA). Answer the following questions: YAMAHA Company Coefficients t Stat P-value Intercept -0.0031 Standard Error 0.008323 0.065043 -0.38187 15.64551 0.70373 2.18E-24 Slope 1.01763 BUBA Company Coefficients Standard Error t Stat 0.02622 0.02407 3.089284 0.0027981 Intercept Slope 1.73073 0.18815 5.703120 2.6878E-07 Is CAPM valid to estimate the rate of return for YAMAHA and BUBA? Why? (2 marks) What is the value of BETA for each? Explain its meaning. (2 marks) Which one is riskier? Explain. (1 marks) P-value 12
Step by Step Solution
There are 3 Steps involved in it
Step: 1

Get Instant Access to Expert-Tailored Solutions
See step-by-step solutions with expert insights and AI powered tools for academic success
Step: 2

Step: 3

Ace Your Homework with AI
Get the answers you need in no time with our AI-driven, step-by-step assistance
Get Started


