

Answered step by step
Verified Expert Solution
Question
1 Approved Answer
The following U . S . crude oil storage chart could represent: a . NYMEX prices are expected to have a strong bullish outlook b
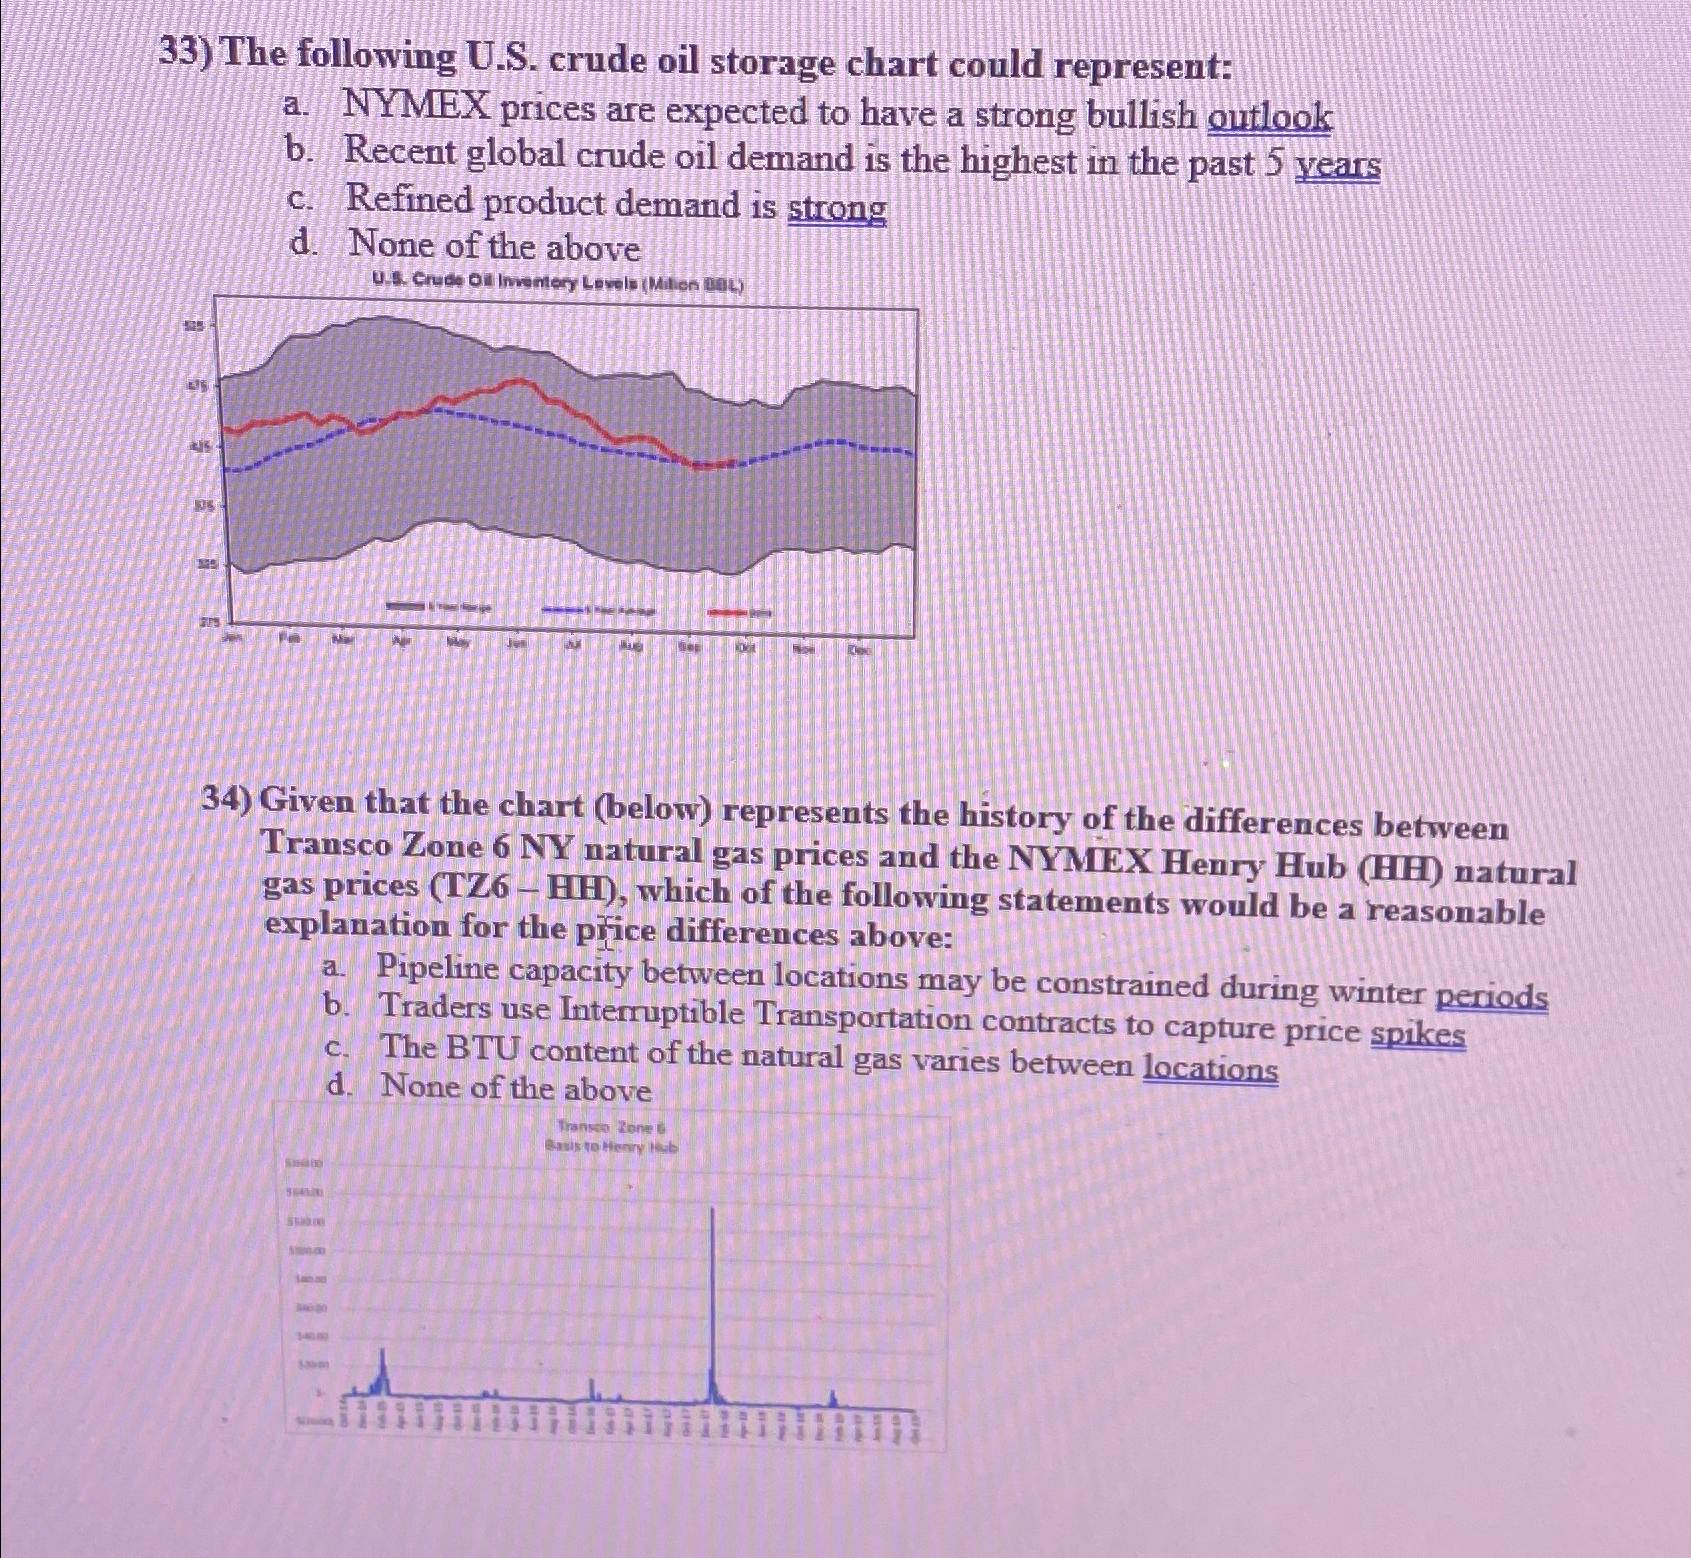
The following US crude oil storage chart could represent:
a NYMEX prices are expected to have a strong bullish outlook
b Recent global crude oil demand is the highest in the past vears
c Refined product demand is strong
d None of the above
Given that the chart below represents the history of the differences between Transco Zone NY natural gas prices and the NYMEX Henry Hub natural gas prices TZ which of the following statements would be a reasonable explanation for the pfice differences above:
a Pipeline capacity between locations may be constrained during winter periods
b Traders use Intemuptible Transportation contracts to capture price spikes
c The BTU content of the natural gas varies between locations
d None of the above
Step by Step Solution
There are 3 Steps involved in it
Step: 1

Get Instant Access to Expert-Tailored Solutions
See step-by-step solutions with expert insights and AI powered tools for academic success
Step: 2

Step: 3
Ace Your Homework with AI
Get the answers you need in no time with our AI-driven, step-by-step assistance
Get Started
Investments
Authors: Zvi Bodie, Alex Kane, Alan Marcus, Stylianos Perrakis, Peter
8th Canadian Edition
007133887X, 978-0071338875