

Answered step by step
Verified Expert Solution
Question
1 Approved Answer
The followng Tableau dashboard visualization represents a periodic table of bond returns for several different bond type left column represents the color key for each
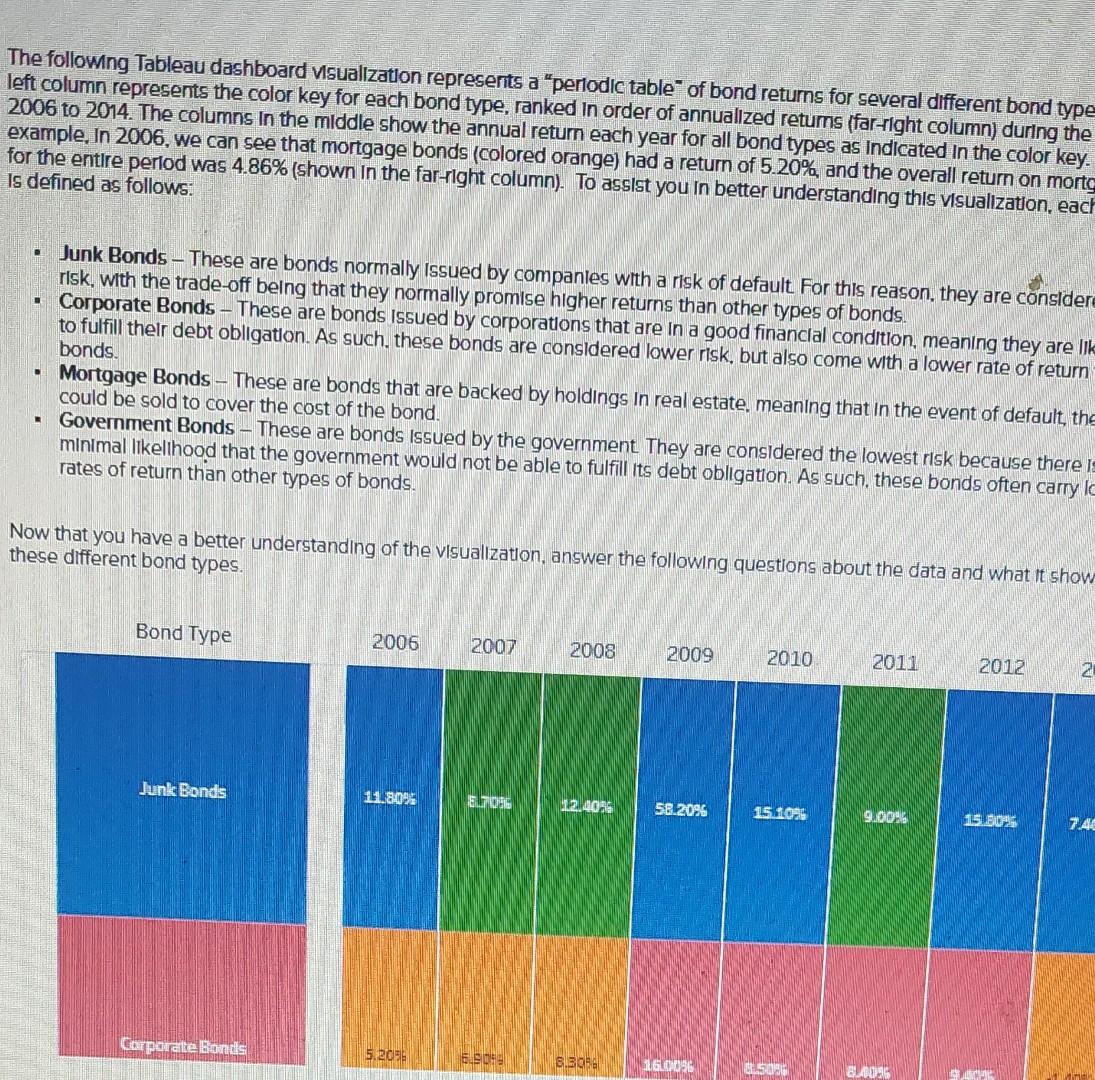
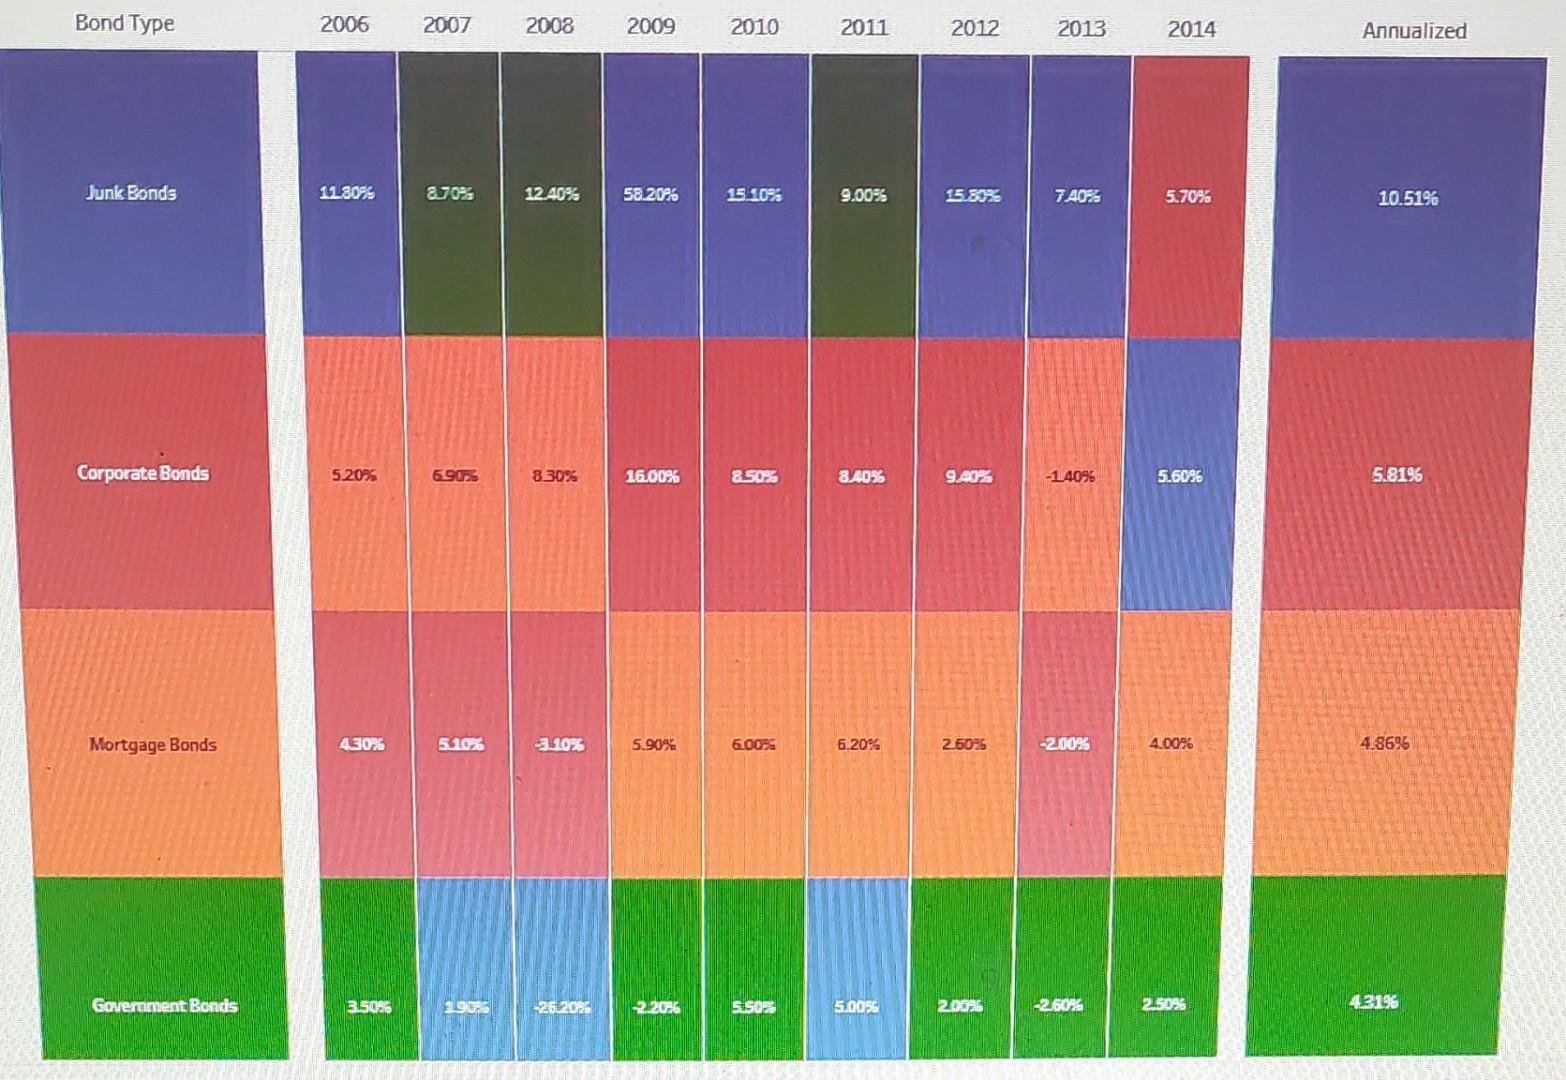
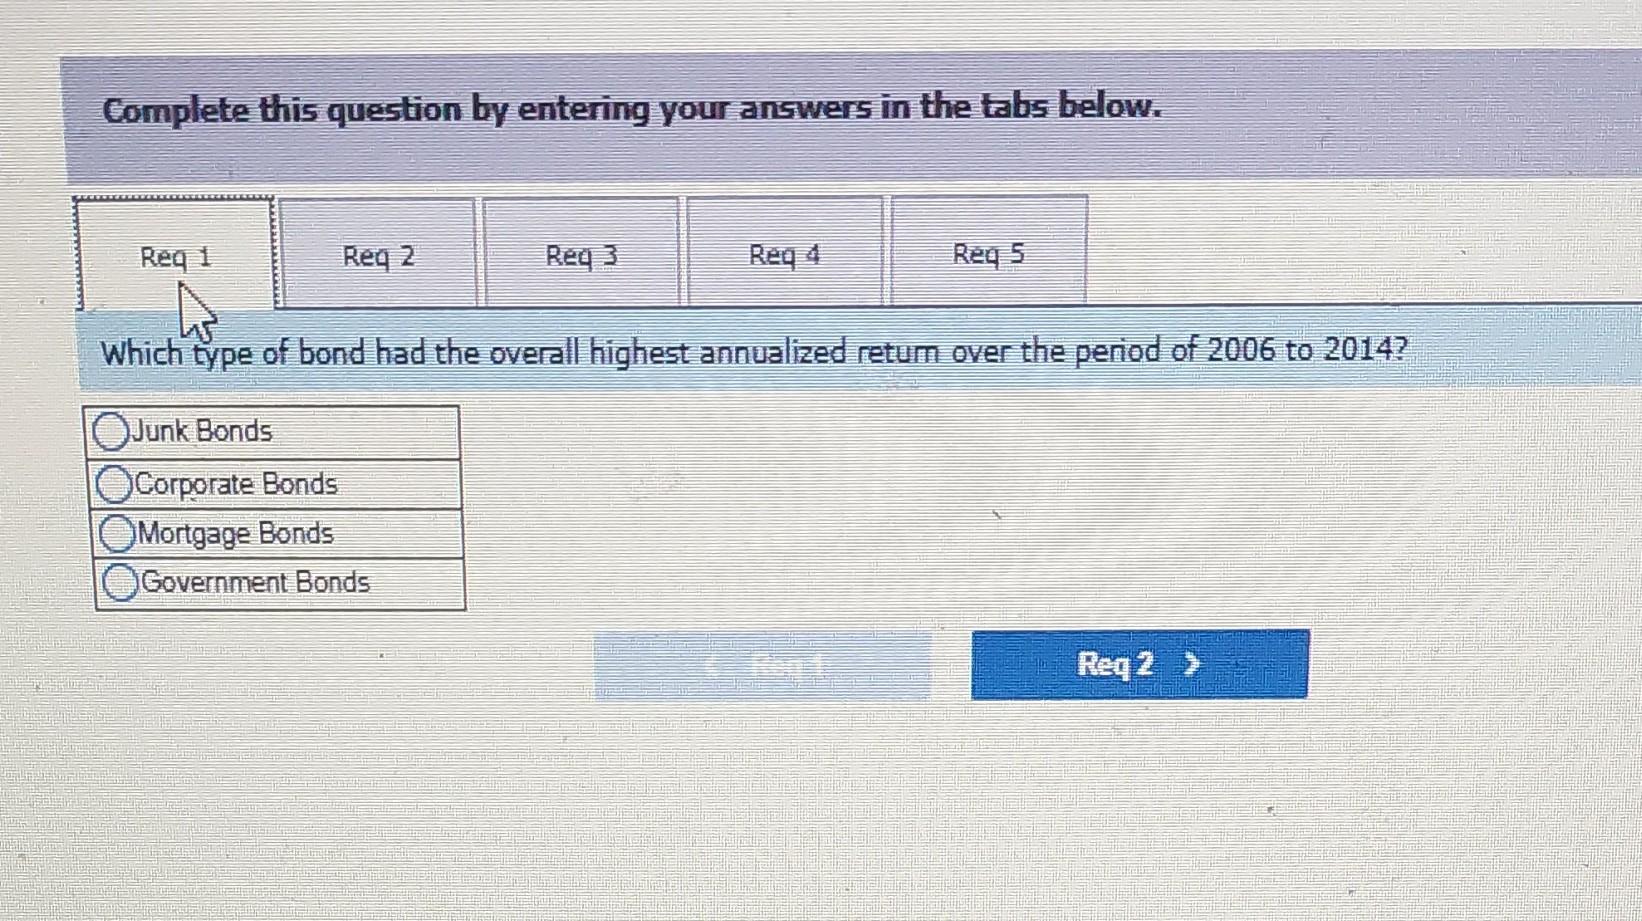
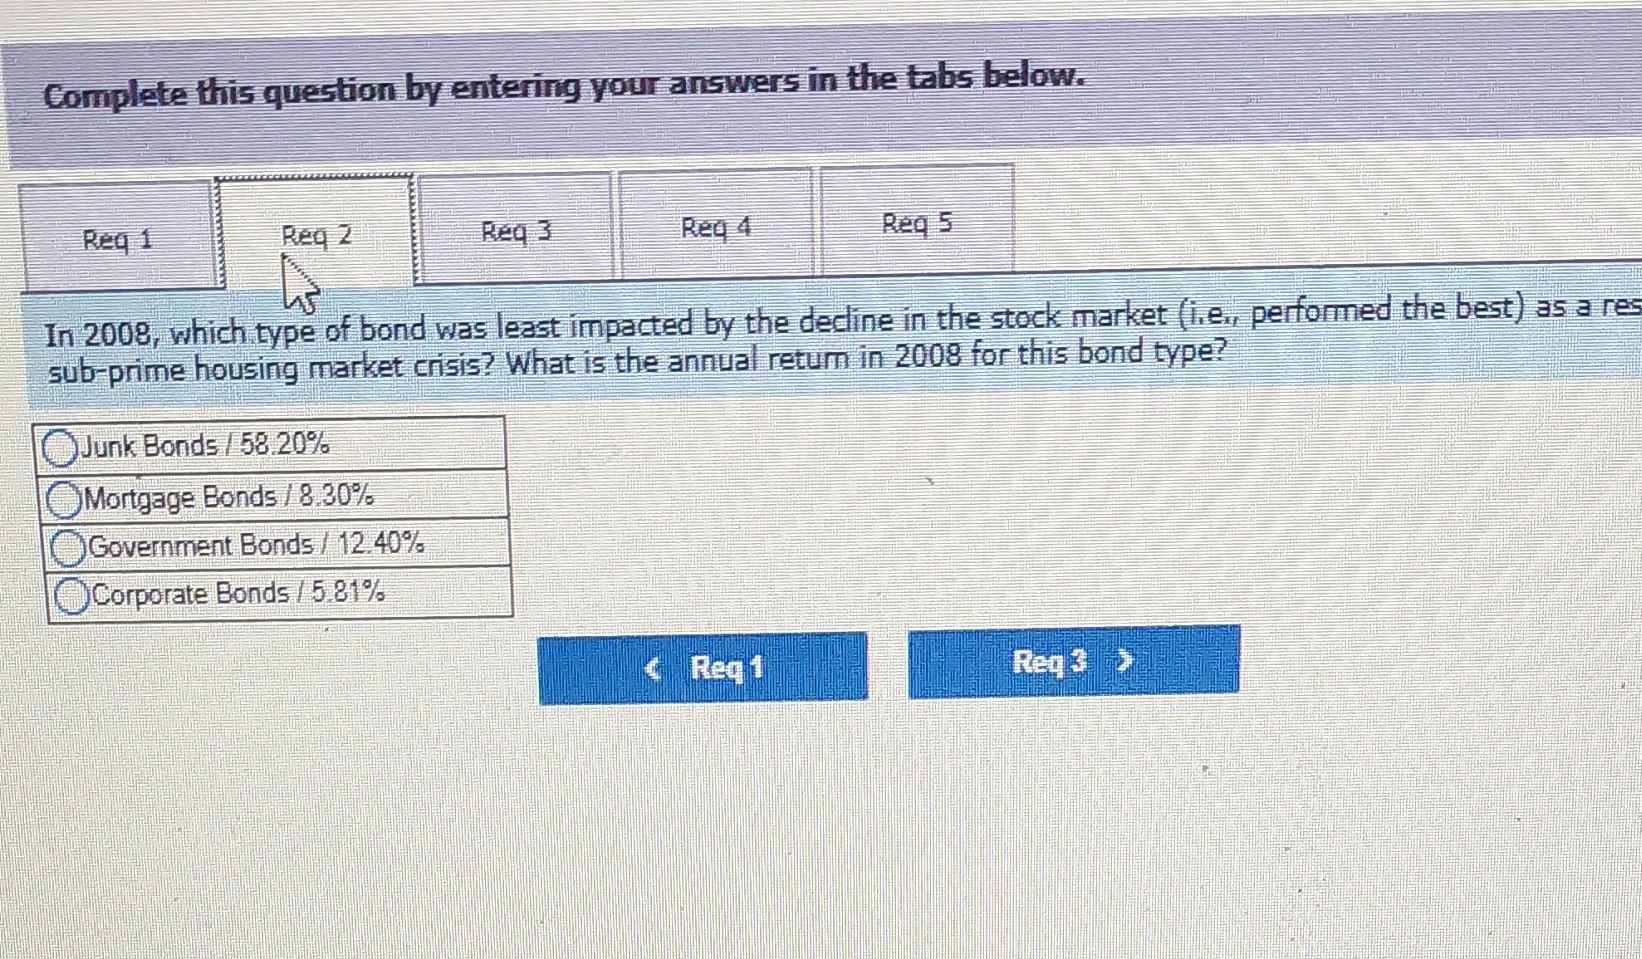

The followng Tableau dashboard visualization represents a "periodic table" of bond returns for several different bond type left column represents the color key for each bond type, ranked in order of annualized returns (far-fight column) during the 2006 to 2014. The columns in the middle show the annual return each year for all bond types as Indicated in the color key. example, In 2006, we can see that mortgage bonds (colored orange) had a return of 5.20%, and the overall return on morts for the entire perlod was 4.86% (shown In the far-right column). To asslst you in better understanding this visualization, eac Is defined as follows: - Junk Bonds - These are bonds normally issued by companies with a risk of default For this reason, they are consider risk, with the trade-off being that they normally promise higher returns than other types of bonds. - Corporate Bonds - These are bonds Issued by corporations that are in a good financlal condition, meaning they are III to fulfill their debt obligation. As such, these bonds are considered lower risk, but also come with a lower rate of return bonds. - Mortgage Bonds - These are bonds that are backed by holdings in real estate. meaning that in the event of default, th could be sold to cover the cost of the bond. - Government Bonds - These are bonds issued by the government They are considered the lowest rlsk because there minimal likelihood that the government would not be able to fulfill its debt obligation. As such, these bonds often carry rates of return than other types of bonds. Now that you have a better understanding of the visualization, answer the following questions about the data and what it shov these different bond types. Complete this question by entering your answers in the tabs below. Whicn type of bond had the overall highest annualized retum over the period of 2006 to 2014 ? \begin{tabular}{|l|} \hline Junk Bonds \\ \hline Corporate Bonds \\ \hline Mortgage Bonds \\ \hline Government Bonds \\ \hline \end{tabular} Complete this question by entering your answers in the tabs below. In 2008, which type of bond was least impacted by the decline in the stock market (i.e., performed the best) as a re sub-prime housing market crisis? What is the annual retum in 2008 for this bond type? \begin{tabular}{|l|} \hline Junk Bonds /58.20% \\ \hline Mortgage Bonds /8.30% \\ \hline Government Bonds /12.40% \\ \hline Corporate Bonds /5.81% \\ \hline \end{tabular} Which type of bond sold at the largest discount based on rates of return in 2009? \begin{tabular}{|l|} \hline Junk Bonds \\ \hline Corporate Bonds \\ \hline Mortgage Bonds \\ \hline Government Bonds \\ \hline \end{tabular} Complete this question by entering your answers in the tabs below. If you have a one-year time horizon to invest in a bond, junk bonds will always have the highest rate of return: Which of the following statements is true based on the data display yed in the visualization? Rates of retum for mortgage bonds consistently outperform corporate bonds over the period. Rates of retum for government bonds consistently yield a higher rate of return than junk bonds over the period. Bonds that are considered more (less) risky tend to yield higher (lower) rates of return. During a recession, holders of junk bonds fare better than holders of government bonds
Step by Step Solution
There are 3 Steps involved in it
Step: 1

Get Instant Access to Expert-Tailored Solutions
See step-by-step solutions with expert insights and AI powered tools for academic success
Step: 2

Step: 3
Ace Your Homework with AI
Get the answers you need in no time with our AI-driven, step-by-step assistance
Get Started
Using Microcomputers In Managerial Accounting
Authors: George Hildebrand
1st Edition
0938188275, 978-0938188278