

Answered step by step
Verified Expert Solution
Question
1 Approved Answer
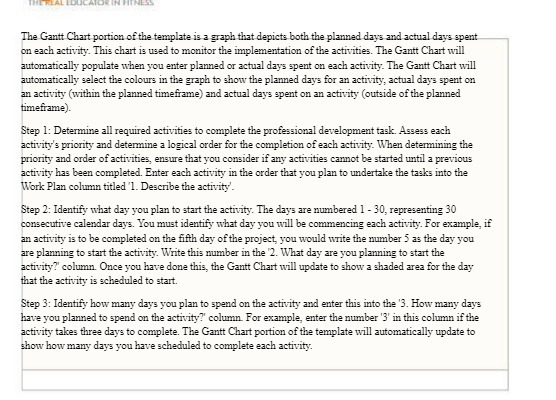
The Gantt Chart portion of the template is a graph that depicts both the planned days and actual days spent on each activity. This chart
Step by Step Solution
There are 3 Steps involved in it
Step: 1

Get Instant Access to Expert-Tailored Solutions
See step-by-step solutions with expert insights and AI powered tools for academic success
Step: 2

Step: 3
Ace Your Homework with AI
Get the answers you need in no time with our AI-driven, step-by-step assistance
Get Started
Fundamentals of Management
Authors: Robbins, DeCenzo, Coulter
7th Edition
132996855, 0-13-610982-9 , 9780132996853, 978-0-13-61098, 978-0136109822