Answered step by step
Verified Expert Solution
Question
1 Approved Answer
The goal is to Plot the VLE diagram of this Acetone distillation column using excel. Please attach a step by step guide for my understanding.
The goal is to Plot the VLE diagram of this Acetone distillation column using excel. Please attach a step by step guide for my understanding.
This is the process description:

So far, I have calculated the following parameters using Fenske equation.

I need help plotting the VLE Diagram using excel. A step by step guide will be appreciated too
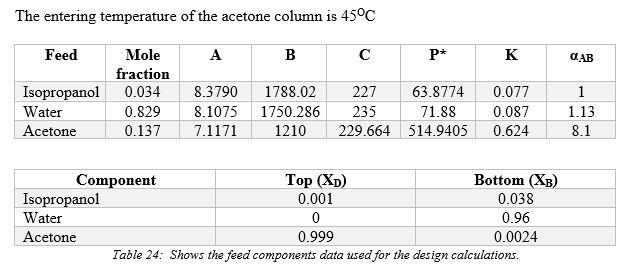
The acetone column will be used to separate the Acetone from the mixture. The entrance temperature is 45C (318K). The respective leaving temperatures for the top and bottom product is 102.3 C (375.3K) and 105 C (378K), the bubble and dew points. The top product of the unit includes acetone isopropyl alcohol, and 99wt% of the product is Acetone. From the bottom of the Acetone column, the remaining isopropyl alcohol, water, and a small amount of 0.1% of Acetone will be discharged. The pressure of the Acetone column is assumed to be constant at 1.1bar. The entering temperature of the acetone column is 45C Feed A B P* K OLAB Isopropanol Water Acetone Mole fraction 0.034 0.829 0.137 8.3790 8.1075 7.1171 1788.02 1750.286 1210 227 63.8774 235 71.88 229.664 514.9405 0.077 0.087 0.624 1 1.13 8.1 Component Top (XD) Bottom (XB) Isopropanol 0.001 0.038 Water 0 0.96 Acetone 0.999 0.0024 Table 24: Shows the feed components data used for the design calculationsStep by Step Solution
There are 3 Steps involved in it
Step: 1

Get Instant Access to Expert-Tailored Solutions
See step-by-step solutions with expert insights and AI powered tools for academic success
Step: 2

Step: 3

Ace Your Homework with AI
Get the answers you need in no time with our AI-driven, step-by-step assistance
Get Started


