

Question
The graph below displays the sample sizes and percentages of people in different age and gender groups who were polled concerning their approval of Mayor
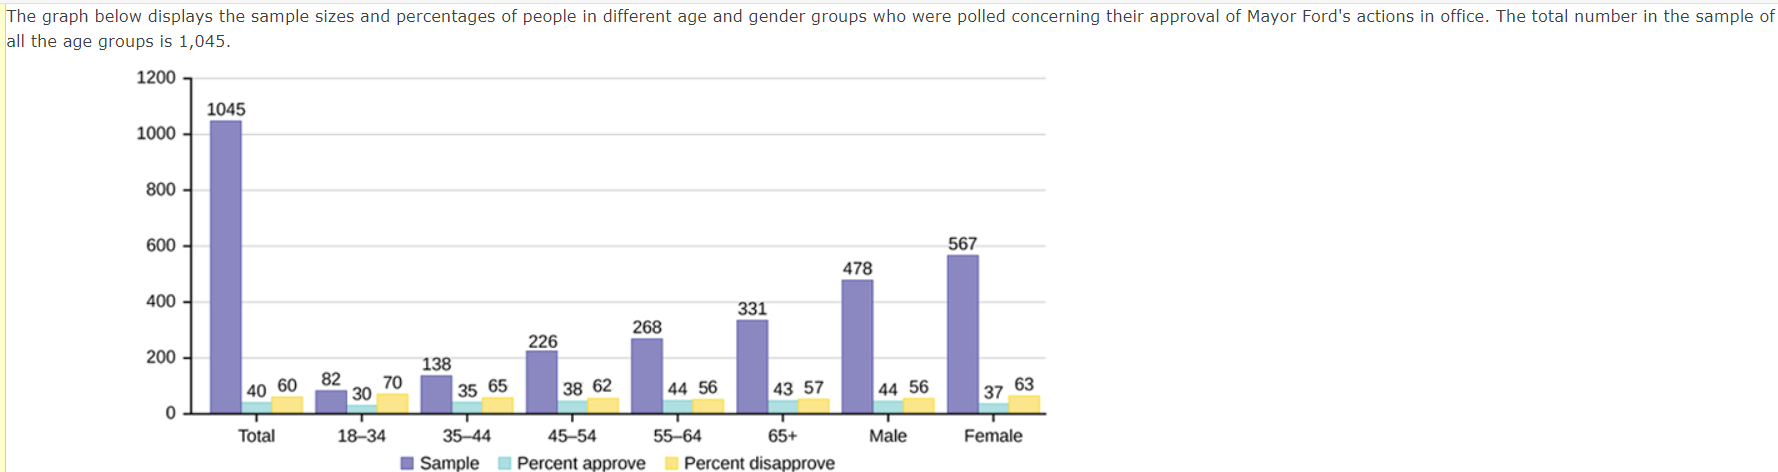
The graph below displays the sample sizes and percentages of people in different age and gender groups who were polled concerning their approval of Mayor Ford's actions in office. The total number in the sample of all the age groups is 1,045.
Step by Step Solution
There are 3 Steps involved in it
Step: 1

Get Instant Access to Expert-Tailored Solutions
See step-by-step solutions with expert insights and AI powered tools for academic success
Step: 2

Step: 3
Ace Your Homework with AI
Get the answers you need in no time with our AI-driven, step-by-step assistance
Get Started
Proofs And Fundamentals A First Course In Abstract Mathematics
Authors: Ethan D Bloch
2nd Edition
1441971270, 9781441971272