Question
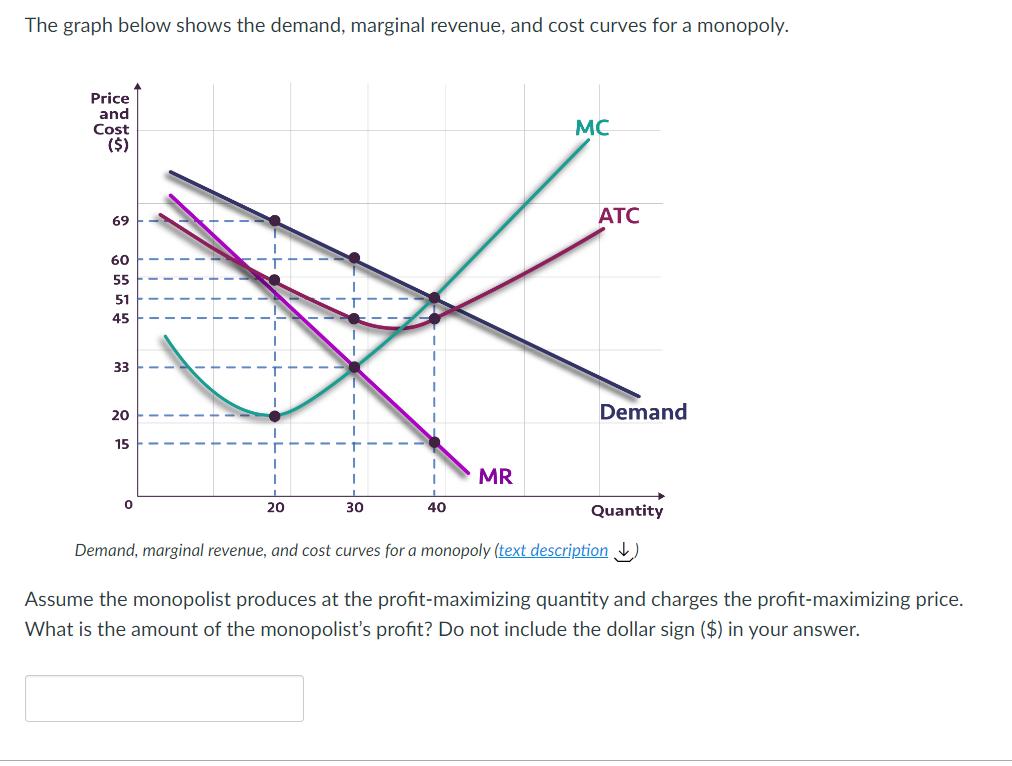
The graph below shows the demand, marginal revenue, and cost curves for a monopoly. Price and Cost ($) 69 60 55 51 45 33

The graph below shows the demand, marginal revenue, and cost curves for a monopoly. Price and Cost ($) 69 60 55 51 45 33 20 15 I MR 20 30 40 MC ATC Demand Quantity Demand, marginal revenue, and cost curves for a monopoly (text description ) Assume the monopolist produces at the profit-maximizing quantity and charges the profit-maximizing price. What is the amount of the monopolist's profit? Do not include the dollar sign ($) in your answer.
Step by Step Solution
There are 3 Steps involved in it
Step: 1
To find the monopolists profit we need to first identify the profit...
Get Instant Access to Expert-Tailored Solutions
See step-by-step solutions with expert insights and AI powered tools for academic success
Step: 2

Step: 3

Ace Your Homework with AI
Get the answers you need in no time with our AI-driven, step-by-step assistance
Get StartedRecommended Textbook for
Microeconomics
Authors: Stephen Slavin
11th Edition
007764154X, 978-0077641542
Students also viewed these Economics questions
Question
Answered: 1 week ago
Question
Answered: 1 week ago
Question
Answered: 1 week ago
Question
Answered: 1 week ago
Question
Answered: 1 week ago
Question
Answered: 1 week ago
Question
Answered: 1 week ago
Question
Answered: 1 week ago
Question
Answered: 1 week ago
Question
Answered: 1 week ago
Question
Answered: 1 week ago
Question
Answered: 1 week ago
Question
Answered: 1 week ago
Question
Answered: 1 week ago
Question
Answered: 1 week ago
Question
Answered: 1 week ago
Question
Answered: 1 week ago
Question
Answered: 1 week ago
Question
Answered: 1 week ago
Question
Answered: 1 week ago
Question
Answered: 1 week ago
Question
Answered: 1 week ago
View Answer in SolutionInn App


