Answered step by step
Verified Expert Solution
Question
1 Approved Answer
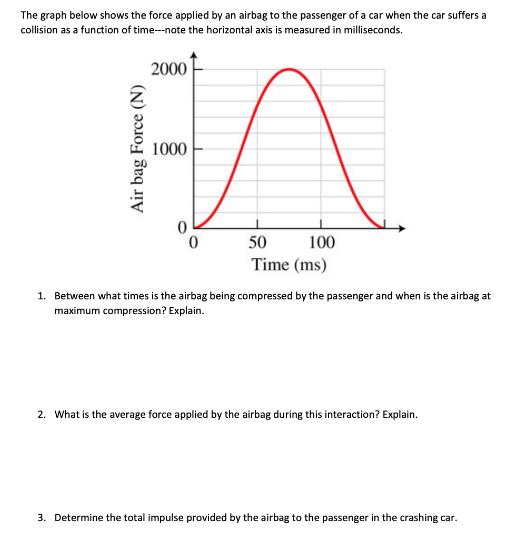
The graph below shows the force applied by an airbag to the passenger of a car when the car suffers a collision as a

The graph below shows the force applied by an airbag to the passenger of a car when the car suffers a collision as a function of time--note the horizontal axis is measured in milliseconds. 2000 FA 1000 50 100 Time (ms) Air bag Force (N) 1. Between what times is the airbag being compressed by the passenger and when is the airbag at maximum compression? Explain. 2. What is the average force applied by the airbag during this interaction? Explain. 3. Determine the total impulse provided by the airbag to the passenger in the crashing car. The graph below shows the force applied by an airbag to the passenger of a car when the car suffers a collision as a function of time--note the horizontal axis is measured in milliseconds. 2000 FA 1000 50 100 Time (ms) Air bag Force (N) 1. Between what times is the airbag being compressed by the passenger and when is the airbag at maximum compression? Explain. 2. What is the average force applied by the airbag during this interaction? Explain. 3. Determine the total impulse provided by the airbag to the passenger in the crashing car.
Step by Step Solution
★★★★★
3.47 Rating (157 Votes )
There are 3 Steps involved in it
Step: 1
a Between what times is the airbag being compressed by the passenger The maximum compression in a fo...
Get Instant Access to Expert-Tailored Solutions
See step-by-step solutions with expert insights and AI powered tools for academic success
Step: 2

Step: 3

Ace Your Homework with AI
Get the answers you need in no time with our AI-driven, step-by-step assistance
Get Started


