

Question
The graph illustrates the distribution of test scores taken by College Algebra students The maximum possible score on the test was 140 while the mean

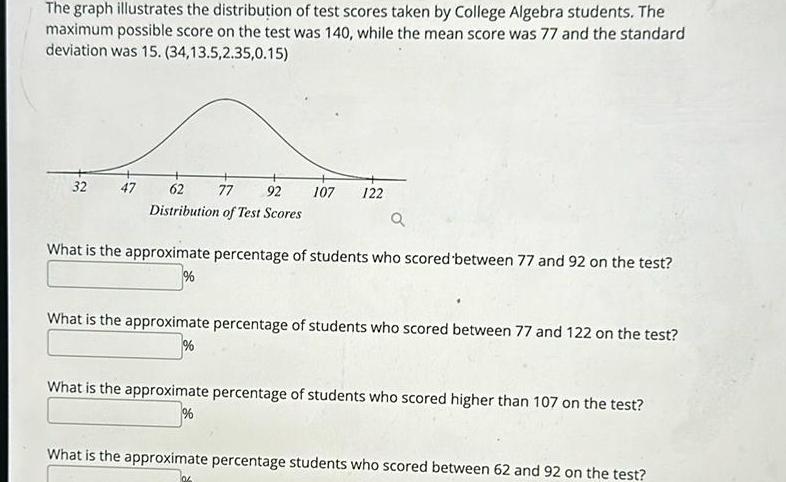
The graph illustrates the distribution of test scores taken by College Algebra students The maximum possible score on the test was 140 while the mean score was 77 and the standard deviation was 15 34 13 5 2 35 0 15 32 47 77 62 Distribution of Test Scores 92 107 122 What is the approximate percentage of students who scored between 77 and 92 on the test What is the approximate percentage of students who scored between 77 and 122 on the test What is the approximate percentage of students who scored higher than 107 on the test What is the approximate percentage students who scored between 62 and 92 on the test loc
Step by Step Solution
There are 3 Steps involved in it
Step: 1

Get Instant Access to Expert-Tailored Solutions
See step-by-step solutions with expert insights and AI powered tools for academic success
Step: 2

Step: 3
Ace Your Homework with AI
Get the answers you need in no time with our AI-driven, step-by-step assistance
Get Started
Introduction To Statistical Investigations
Authors: Beth L.Chance, George W.Cobb, Allan J.Rossman Nathan Tintle, Todd Swanson Soma Roy
2nd Edition
1119683459, 978-1119683452