

Answered step by step
Verified Expert Solution
Question
1 Approved Answer
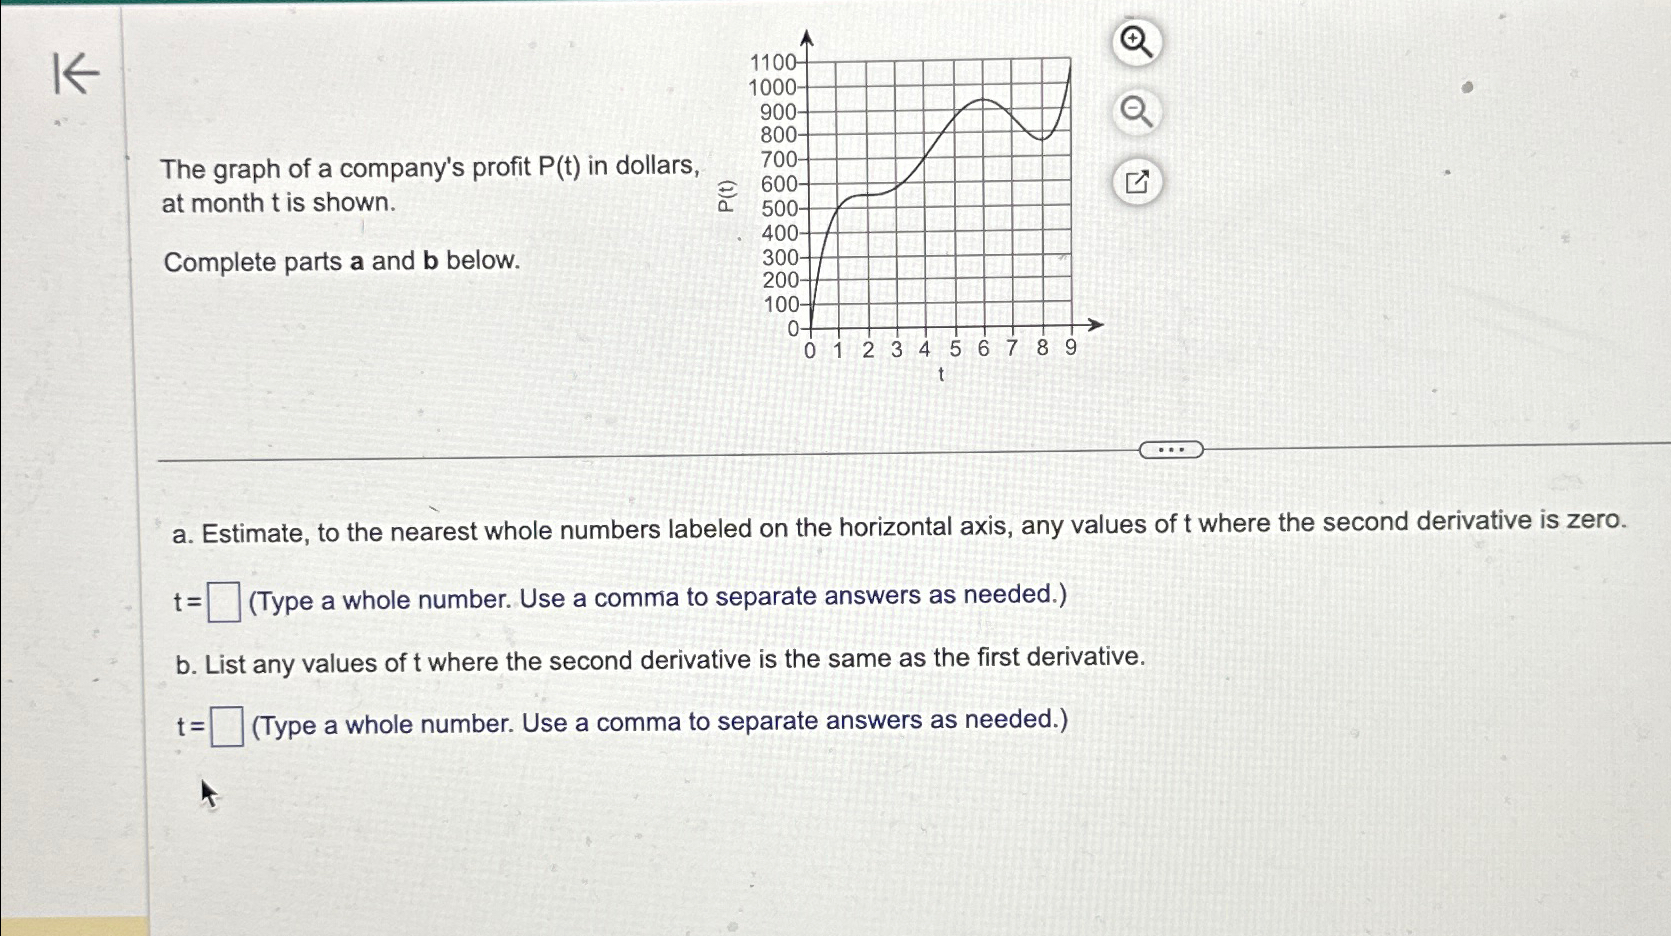
The graph of a company's profit P ( t ) in dollars, at month t is shown. Complete parts a and b below. a .
The graph of a company's profit in dollars, at month is shown.
Complete parts a and below.
a Estimate, to the nearest whole numbers labeled on the horizontal axis, any values of where the second derivative is zero.
Type a whole number. Use a comma to separate answers as needed.
b List any values of where the second derivative is the same as the first derivative.
Type a whole number. Use a comma to separate answers as needed.
Step by Step Solution
There are 3 Steps involved in it
Step: 1

Get Instant Access to Expert-Tailored Solutions
See step-by-step solutions with expert insights and AI powered tools for academic success
Step: 2

Step: 3
Ace Your Homework with AI
Get the answers you need in no time with our AI-driven, step-by-step assistance
Get Started
Unclaimed Property A Reporting Process And Audit Survival Guide
Authors: Tracey L. Reid
1st Edition
0470278242, 978-0470278246