Question
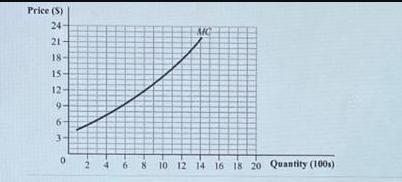
The graph shows a firm's marginal cost curve. This firm operates in a perfectly competitive industry with market demand and supply curves given by


The graph shows a firm's marginal cost curve. This firm operates in a perfectly competitive industry with market demand and supply curves given by Qd = 100-8 P and QS=-20+2 P. where Q is measured in millions of units. Based on the figure, how many units of output will the firm produce at the equilibrium price? OA. 400 B. 1,100 OC. 800 OD. 1,200 Price (S) 24 21- 852 12 9 3- -21 fo 10 MG 8 10 12 14 16 18 20 Quantity (100s).
Step by Step Solution
3.34 Rating (154 Votes )
There are 3 Steps involved in it
Step: 1
The detailed answer for the above question is provided below given that market demand 100 8P ...
Get Instant Access to Expert-Tailored Solutions
See step-by-step solutions with expert insights and AI powered tools for academic success
Step: 2

Step: 3

Ace Your Homework with AI
Get the answers you need in no time with our AI-driven, step-by-step assistance
Get StartedRecommended Textbook for
Microeconomics
Authors: Douglas Bernheim, Michael Whinston
2nd edition
73375853, 978-0073375854
Students also viewed these Accounting questions
Question
Answered: 1 week ago
Question
Answered: 1 week ago
Question
Answered: 1 week ago
Question
Answered: 1 week ago
Question
Answered: 1 week ago
Question
Answered: 1 week ago
Question
Answered: 1 week ago
Question
Answered: 1 week ago
Question
Answered: 1 week ago
Question
Answered: 1 week ago
Question
Answered: 1 week ago
Question
Answered: 1 week ago
Question
Answered: 1 week ago
Question
Answered: 1 week ago
Question
Answered: 1 week ago
Question
Answered: 1 week ago
Question
Answered: 1 week ago
Question
Answered: 1 week ago
Question
Answered: 1 week ago
Question
Answered: 1 week ago
Question
Answered: 1 week ago
View Answer in SolutionInn App


