Answered step by step
Verified Expert Solution
Question
1 Approved Answer
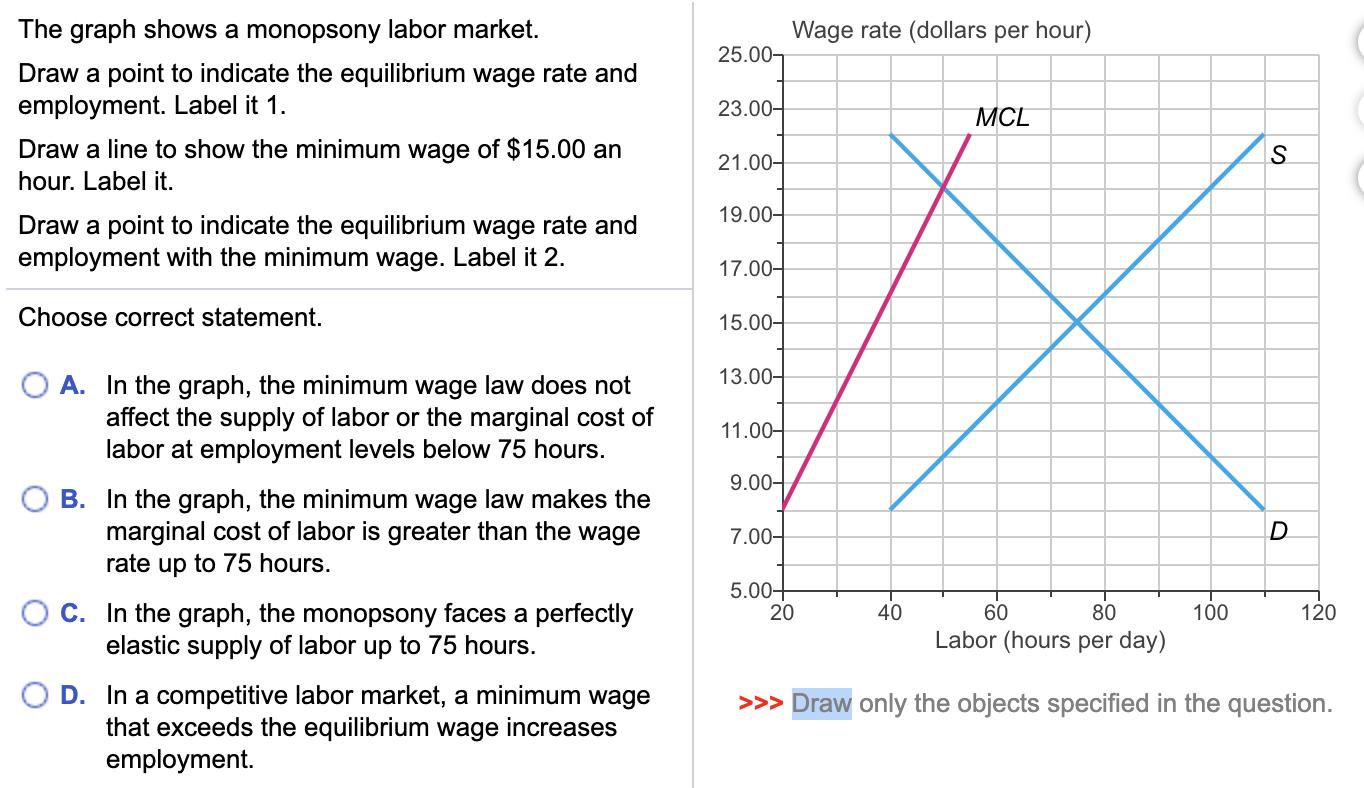
The graph shows a monopsony labor market. Draw a point to indicate the equilibrium wage rate and employment. Label it 1. Draw a line

The graph shows a monopsony labor market. Draw a point to indicate the equilibrium wage rate and employment. Label it 1. Draw a line to show the minimum wage of $15.00 an hour. Label it. Draw a point to indicate the equilibrium wage rate and employment with the minimum wage. Label it 2. Choose correct statement. A. In the graph, the minimum wage law does not affect the supply of labor or the marginal cost of labor at employment levels below 75 hours. B. In the graph, the minimum wage law makes the marginal cost of labor is greater than the wage rate up to 75 hours. C. In the graph, the monopsony faces a perfectly elastic supply of labor up to 75 hours. D. In a competitive labor market, a minimum wage that exceeds the equilibrium wage increases employment. 25.00 23.00- 21.00- 19.00- 17.00- 15.00- 13.00- 11.00- 9.00- 7.00- Wage rate (dollars per hour) 5.00+ 20 MCL 40 60 80 Labor (hours per day) >>> Draw only the objects specified in the question. S 100 D 120
Step by Step Solution
There are 3 Steps involved in it
Step: 1
Monopsonist faces a demand curve for labor at D which is essentially MRP or the marginal revenue pro...
Get Instant Access to Expert-Tailored Solutions
See step-by-step solutions with expert insights and AI powered tools for academic success
Step: 2

Step: 3

Ace Your Homework with AI
Get the answers you need in no time with our AI-driven, step-by-step assistance
Get Started


