Answered step by step
Verified Expert Solution
Question
1 Approved Answer
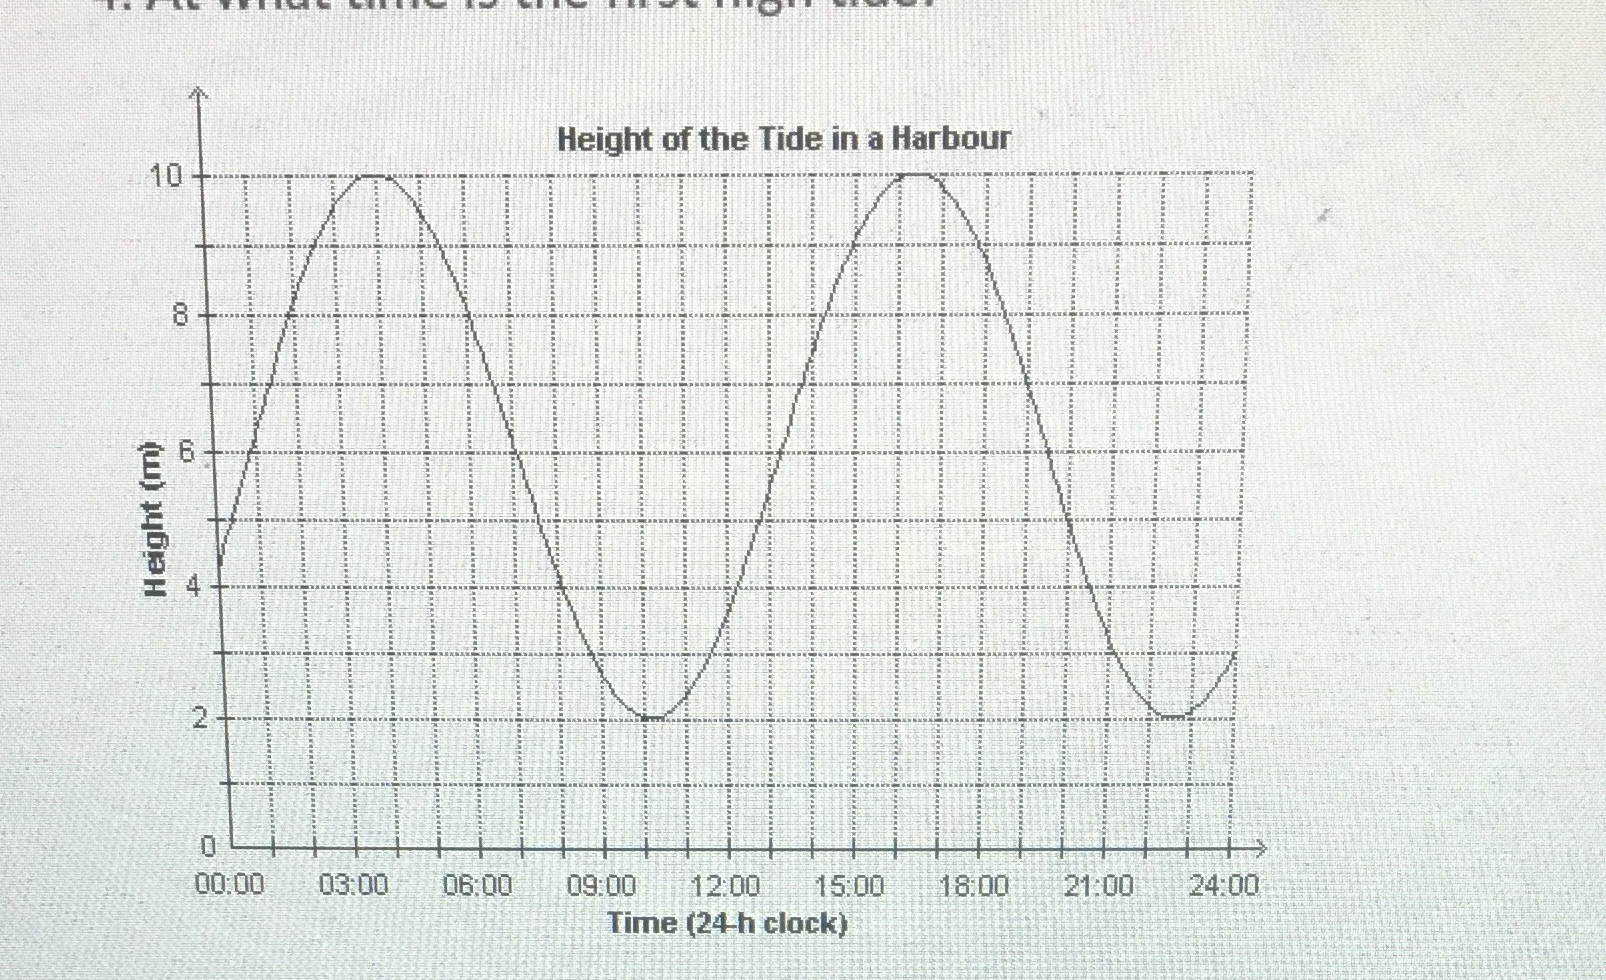
The graph shows the height of the tide in a harbour as a function of time in one day. JUST enter the number of your
The graph shows the height of the tide in a harbour as a function of time in one day. JUST enter the number of your answer to the nearest whole number..1. About how high is the tide at 7 pm to the nearest meters2. What is f(8)3. What is a possible value of f(t)=8 to the nearest meter4. At what time is the first tide

Step by Step Solution
There are 3 Steps involved in it
Step: 1

Get Instant Access to Expert-Tailored Solutions
See step-by-step solutions with expert insights and AI powered tools for academic success
Step: 2

Step: 3

Ace Your Homework with AI
Get the answers you need in no time with our AI-driven, step-by-step assistance
Get Started


