Answered step by step
Verified Expert Solution
Question
1 Approved Answer
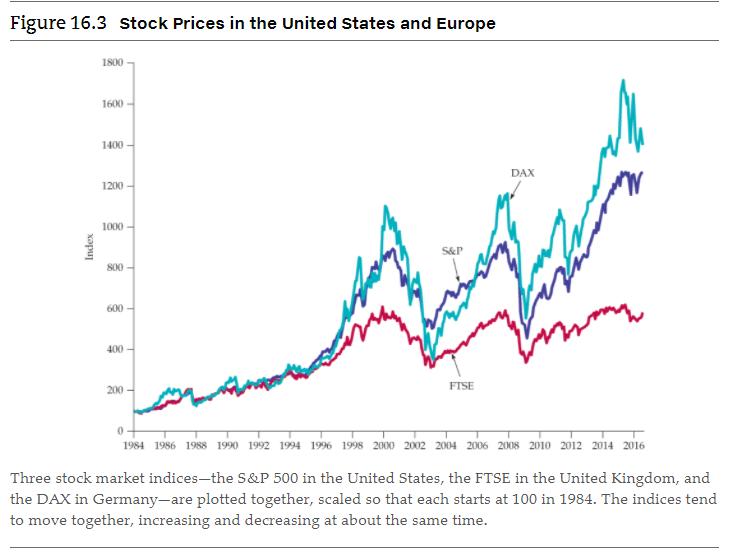
The graph shows the plots of three major stock indices - the S&P 500 in the United States, the FTSE in the United Kingdom, and
The graph shows the plots of three major stock indices - the S&P 500 in the United States, the FTSE in the United Kingdom, and the DAX in Germany. The indices tend to move together, increasing and decreasing at about the same time. Why do stock markets tend to move together? (Give the two 'general equilibrium' reasons)

Figure 16.3 Stock Prices in the United States and Europe Index 1800- 1600 1400- 1200 1000 800 T 600- 400- 200- Zach S&P FISE DAX m 1984 1986 1988 1990 1992 1994 1996 1998 2000 2002 2004 2006 2008 2010 2012 2014 2016 Three stock market indices-the S&P 500 in the United States, the FTSE in the United Kingdom, and the DAX in Germany-are plotted together, scaled so that each starts at 100 in 1984. The indices tend to move together, increasing and decreasing at about the same time.
Step by Step Solution
★★★★★
3.46 Rating (159 Votes )
There are 3 Steps involved in it
Step: 1
One of the reason is existence of global economic interdependence Most economies of around the ...
Get Instant Access to Expert-Tailored Solutions
See step-by-step solutions with expert insights and AI powered tools for academic success
Step: 2

Step: 3

Ace Your Homework with AI
Get the answers you need in no time with our AI-driven, step-by-step assistance
Get Started


