Answered step by step
Verified Expert Solution
Link Copied!

Question

1 Approved Answer

The graphs below show the distributions for samples of delay times for three different BC ferry runs. a. 25% of the delay times for the
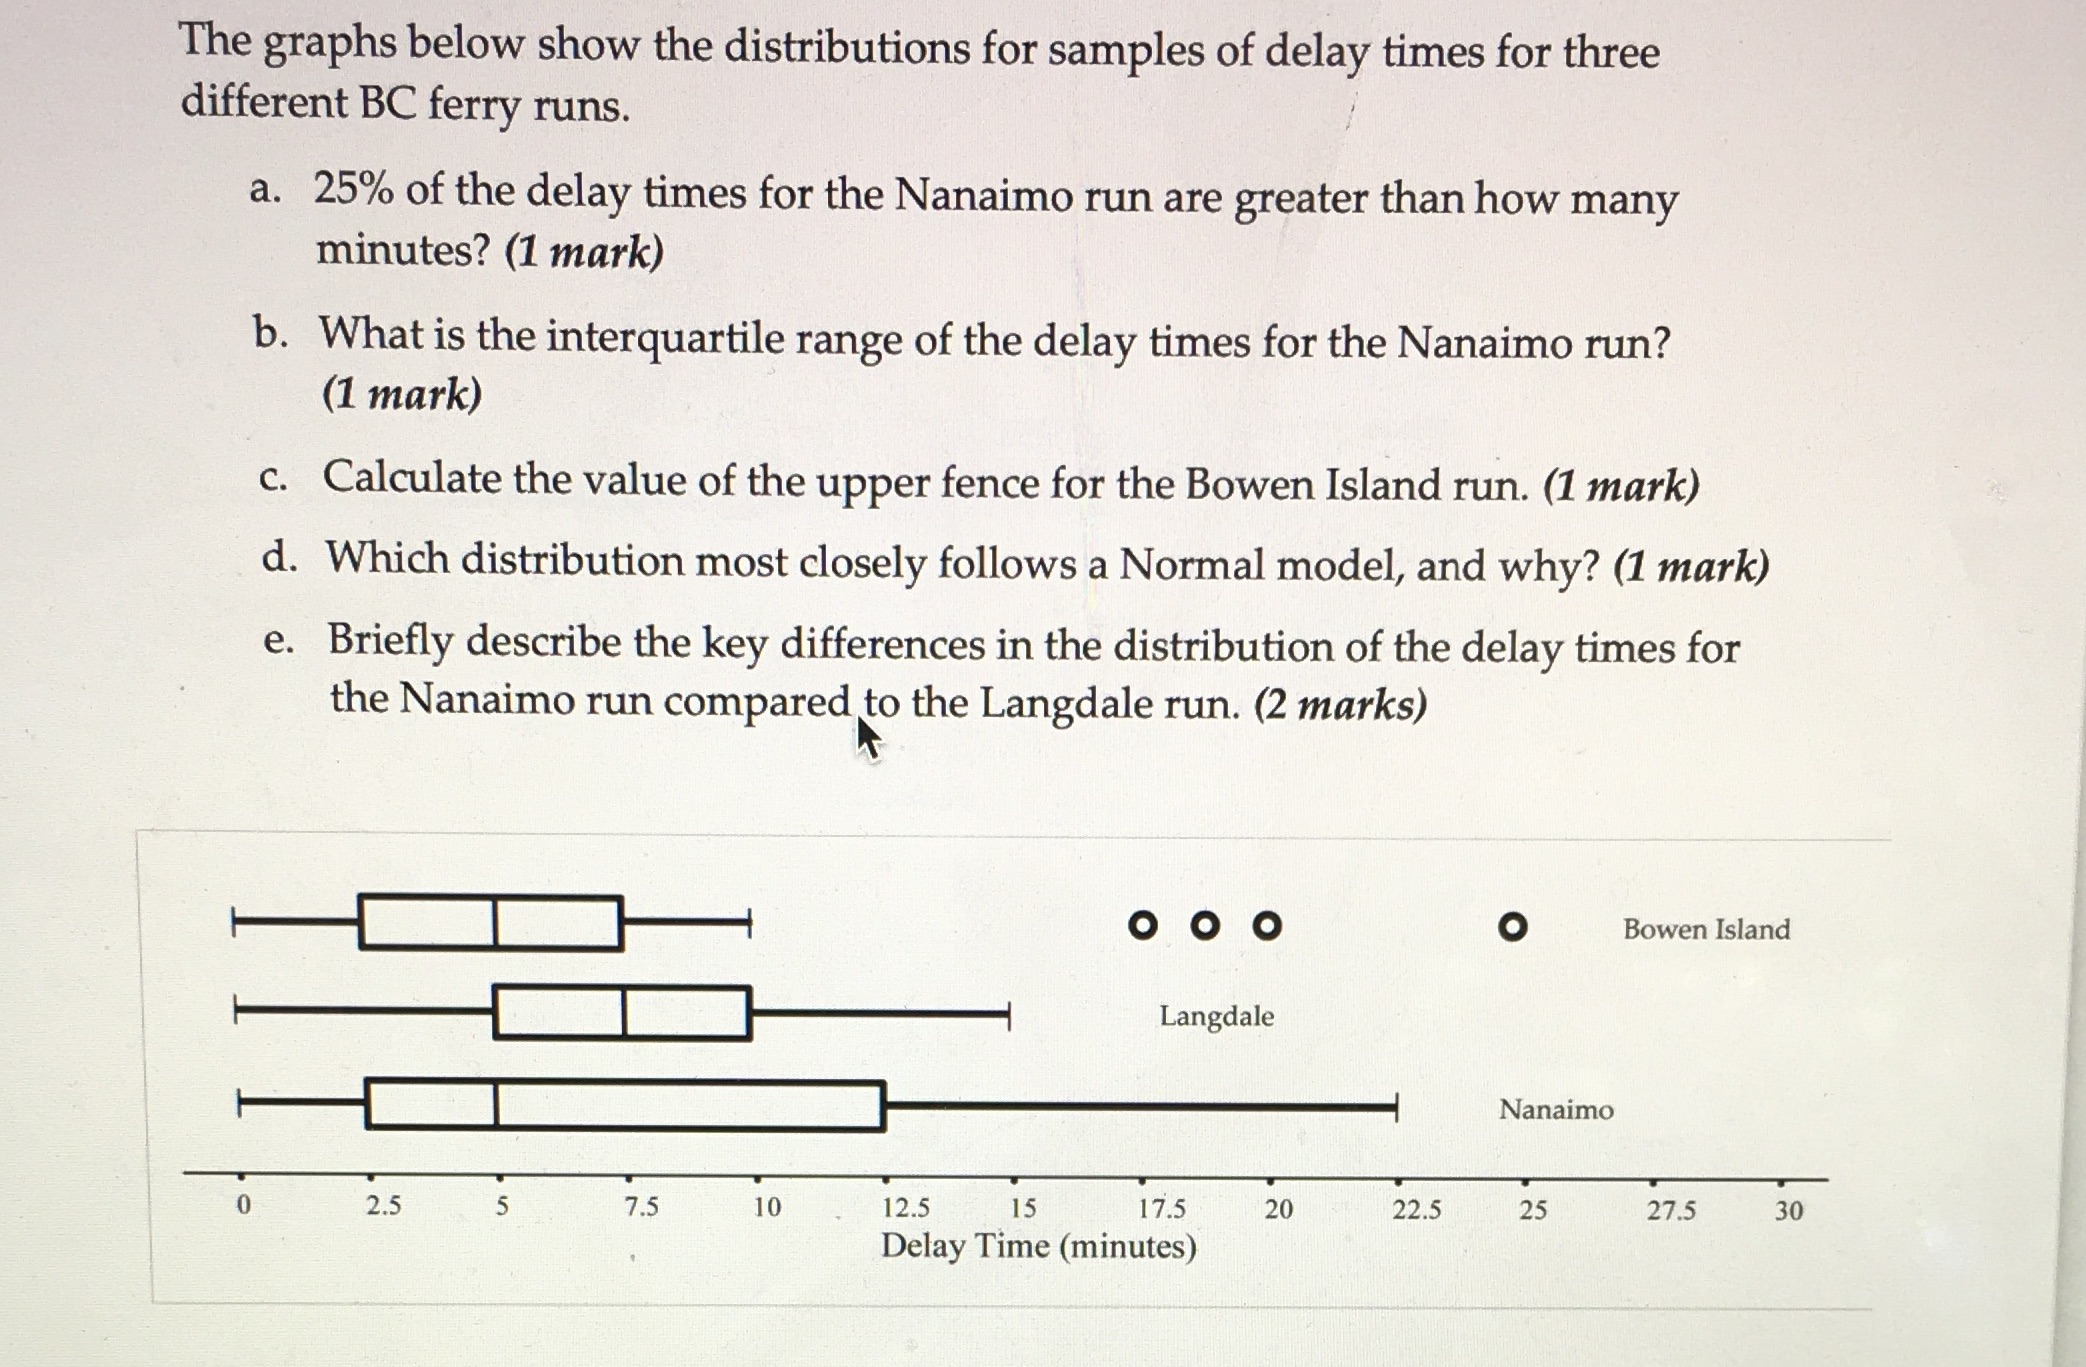
image text in transcribed
The graphs below show the distributions for samples of delay times for three different BC ferry runs. a. 25% of the delay times for the Nanaimo run are greater than how many minutes? (1 mark) b. What is the interquartile range of the delay times for the Nanaimo run? (1 mark) c. Calculate the value of the upper fence for the Bowen Island run. (1 mark) d. Which distribution most closely follows a Normal model, and why? (1 mark) e. Briefly describe the key differences in the distribution of the delay times for the Nanaimo run compared to the Langdale run. (2 marks) OOO O Bowen Island Langdale Nanaimo 2.5 5 7.5 10 12.5 15 17.5 20 22.5 25 27.5 30 Delay Time (minutes)

Step by Step Solution

There are 3 Steps involved in it

Step: 1

blur-text-image

Get Instant Access to Expert-Tailored Solutions

See step-by-step solutions with expert insights and AI powered tools for academic success

Step: 2

blur-text-image

Step: 3

blur-text-image

Ace Your Homework with AI

Get the answers you need in no time with our AI-driven, step-by-step assistance

Get Started

Recommended Textbook for

Finite Math And Applied Calculus

Authors: Stefan Waner, Steven Costenoble

7th Edition

1337515566, 9781337515566

More Books

Students also viewed these Mathematics questions

Question

What is a balanced growth path?

Answered: 1 week ago

Question

4. Support and enliven your speech with effective research

Answered: 1 week ago

Question

3. Choose an appropriate topic and develop it

Answered: 1 week ago