Answered step by step
Verified Expert Solution
Question
1 Approved Answer
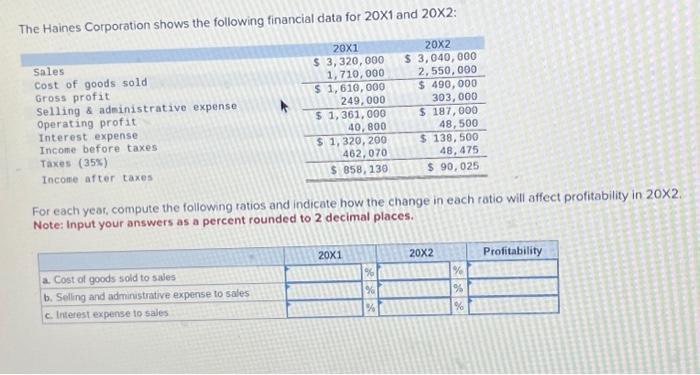
The Haines Corporation shows the following financial data for 20X1 and 20X2: Sales Cost of goods sold Gross profit Selling & administrative expense Operating profit
The Haines Corporation shows the following financial data for 20X1 and 20X2: Sales Cost of goods sold Gross profit Selling & administrative expense Operating profit Interest expense Income before taxes Taxes (35%) Income after taxes 20X1 $ 3,320,000 1, 710,000 a. Cost of goods sold to sales b. Selling and administrative expense to sales c. Interest expense to sales $ 1,610,000 249,000 $ 1,361, 000 40,800 $ 1,320, 200 462,070 $ 858, 130 For each year, compute the following ratios and indicate how the change in each ratio will affect profitability in 20X2. Note: Input your answers as a percent rounded to 2 decimal places. 20X1 20X2 $ 3,040,000 2,550,000 $ 490,000 303,000 $ 187,000 48,500 $ 138,500 48,475 $ 90,025 % % % 20X2 % % % Profitability

Step by Step Solution
There are 3 Steps involved in it
Step: 1

Get Instant Access to Expert-Tailored Solutions
See step-by-step solutions with expert insights and AI powered tools for academic success
Step: 2

Step: 3

Ace Your Homework with AI
Get the answers you need in no time with our AI-driven, step-by-step assistance
Get Started


