Answered step by step
Verified Expert Solution
Question
1 Approved Answer
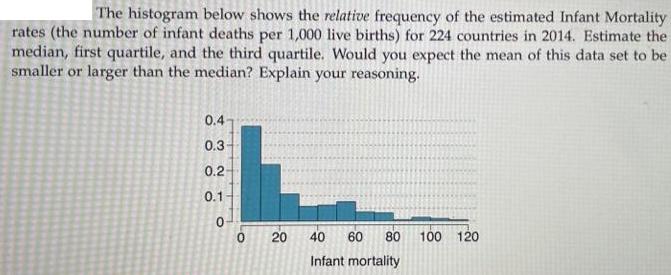
The histogram below shows the relative frequency of the estimated Infant Mortality rates (the number of infant deaths per 1,000 live births) for 224

The histogram below shows the relative frequency of the estimated Infant Mortality rates (the number of infant deaths per 1,000 live births) for 224 countries in 2014. Estimate the median, first quartile, and the third quartile. Would you expect the mean of this data set to be smaller or larger than the median? Explain your reasoning. 0.4 0.3 0.2 0.1 0 0 20 60 80 100 120 40 Infant mortality
Step by Step Solution
There are 3 Steps involved in it
Step: 1
Solution From the given histogram gra...
Get Instant Access to Expert-Tailored Solutions
See step-by-step solutions with expert insights and AI powered tools for academic success
Step: 2

Step: 3

Ace Your Homework with AI
Get the answers you need in no time with our AI-driven, step-by-step assistance
Get Started


