

Answered step by step
Verified Expert Solution
Question
1 Approved Answer
The histogram shows the distribution of hurricanes that have hit a country from 1851 through 2015, where 1 is the weakest level and 5 is
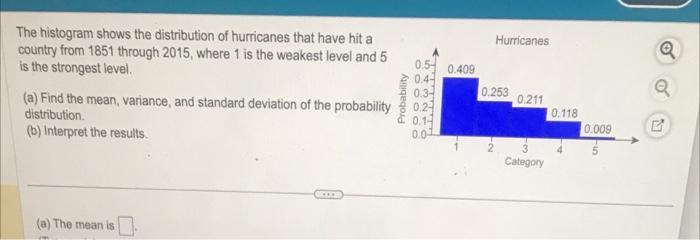 The histogram shows the distribution of hurricanes that have hit a country from 1851 through 2015, where 1 is the weakest level and 5 is the strongest level. (a) Find the mean, variance, and standard deviation of the probability distribution. (b) Interpret the results
Step by Step Solution
There are 3 Steps involved in it
Step: 1

Get Instant Access with AI-Powered Solutions
See step-by-step solutions with expert insights and AI powered tools for academic success
Step: 2

Step: 3
Ace Your Homework with AI
Get the answers you need in no time with our AI-driven, step-by-step assistance
Get Started