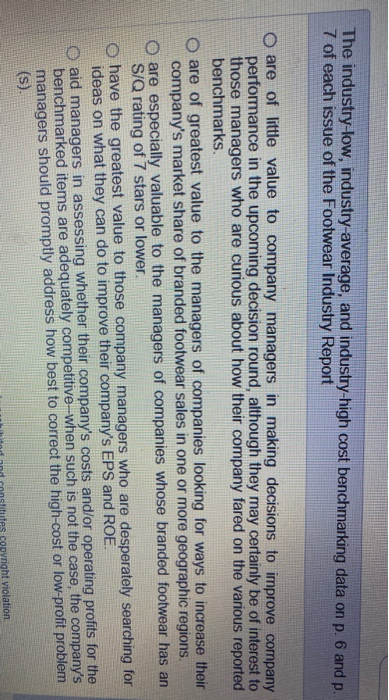
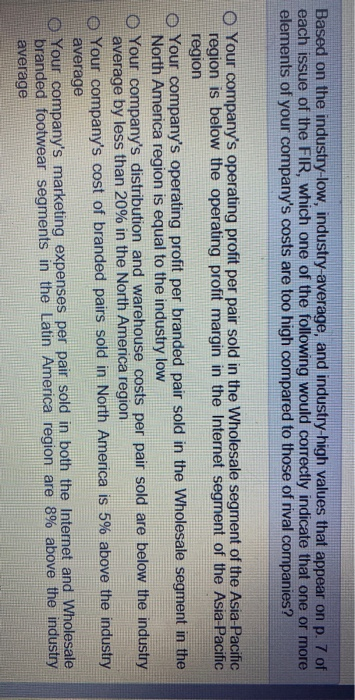
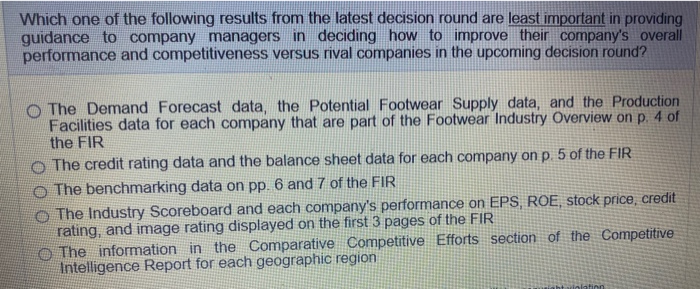
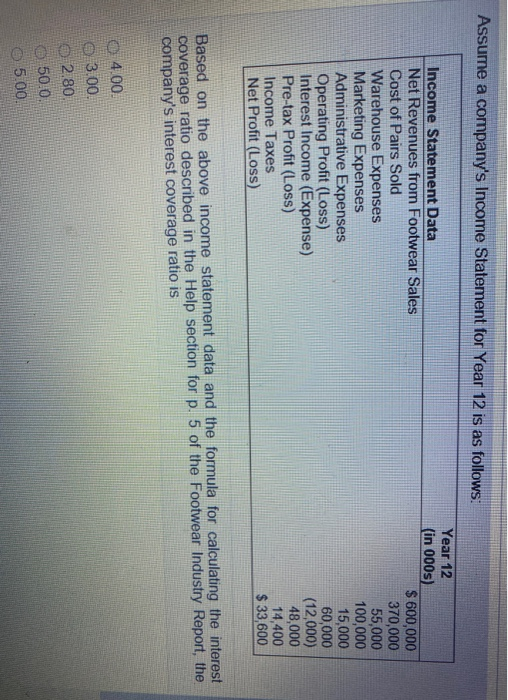
The industry-low, industry average, and industry-high cost benchmarking data on p. 6 and p. 7 of each issue of the Footwear Industry Report o are of little value to company managers in making decisions to improve company performance in the upcoming decision round, although they may certainly be of interest to those managers who are curious about how their company fared on the various reported benchmarks. O are of greatest value to the managers of companies looking for ways to increase their company's market share of branded footwear sales in one or more geographic regions. o are especially valuable to the managers of companies whose branded footwear has an S/Q rating of 7 stars or lower o have the greatest value to those company managers who are desperately searching for ideas on what they can do to improve their company's EPS and ROE. aid managers in assessing whether their company's costs and/or operating profits for the benchmarked items are adequately competitive-when such is not the case, the company's managers should promptly address how best to correct the high-cost or low-profit problem (S) Illihind and constitutes copyright violation Based on the industry-low, industry-average, and industry-high values that appear on p. 7 of each issue of the FIR, which one of the following would correctly indicate that one or more elements of your company's costs are too high compared to those of rival companies? O Your company's operating profit per pair sold in the Wholesale segment of the Asia-Pacific region is below the operating profit margin in the Internet segment of the Asia-Pacific region O Your company's operating profit per branded pair sold in the Wholesale segment in the North America region is equal to the industry low O Your company's distribution and warehouse costs per pair sold are below the industry average by less than 20% in the North America region Your company's cost of branded pairs sold in North America is 5% above the industry average Your company's marketing expenses per pair sold in both the Internet and Wholesale branded footwear segments in the Latin America region are 8% above the industry average Which one of the following results from the latest decision round are least important in providing guidance to company managers in deciding how to improve their company's overall performance and competitiveness versus rival companies in the upcoming decision round? The Demand Forecast data, the Potential Footwear Supply data, and the Production Facilities data for each company that are part of the Footwear Industry Overview on p. 4 of the FIR The credit rating data and the balance sheet data for each company on p 5 of the FIR The benchmarking data on pp. 6 and 7 of the FIR The Industry Scoreboard and each company's performance on EPS, ROE, stock price, credit rating, and image rating displayed on the first 3 pages of the FIR The information in the Comparative Competitive Efforts section of the Competitive Intelligence Report for each geographic region Assume a company's Income Statement for Year 12 is as follows: Income Statement Data Net Revenues from Footwear Sales Cost of Pairs Sold Warehouse Expenses Marketing Expenses Administrative Expenses Operating Profit (Loss) Interest Income (Expense) Pre-tax Profit (Loss) Income Taxes Net Profit (Loss) Year 12 (in 000s) $ 600,000 370,000 55,000 100,000 15,000 60,000 (12,000) 48,000 14,400 $ 33,600 Based on the above income statement data and the formula for calculating the interest coverage ratio described in the Help section for p. 5 of the Footwear Industry Report, the company's interest coverage ratio is 04.00. 03.00. 2.80 50.0. 5.00. The industry-low, industry average, and industry-high cost benchmarking data on p. 6 and p. 7 of each issue of the Footwear Industry Report o are of little value to company managers in making decisions to improve company performance in the upcoming decision round, although they may certainly be of interest to those managers who are curious about how their company fared on the various reported benchmarks. O are of greatest value to the managers of companies looking for ways to increase their company's market share of branded footwear sales in one or more geographic regions. o are especially valuable to the managers of companies whose branded footwear has an S/Q rating of 7 stars or lower o have the greatest value to those company managers who are desperately searching for ideas on what they can do to improve their company's EPS and ROE. aid managers in assessing whether their company's costs and/or operating profits for the benchmarked items are adequately competitive-when such is not the case, the company's managers should promptly address how best to correct the high-cost or low-profit problem (S) Illihind and constitutes copyright violation Based on the industry-low, industry-average, and industry-high values that appear on p. 7 of each issue of the FIR, which one of the following would correctly indicate that one or more elements of your company's costs are too high compared to those of rival companies? O Your company's operating profit per pair sold in the Wholesale segment of the Asia-Pacific region is below the operating profit margin in the Internet segment of the Asia-Pacific region O Your company's operating profit per branded pair sold in the Wholesale segment in the North America region is equal to the industry low O Your company's distribution and warehouse costs per pair sold are below the industry average by less than 20% in the North America region Your company's cost of branded pairs sold in North America is 5% above the industry average Your company's marketing expenses per pair sold in both the Internet and Wholesale branded footwear segments in the Latin America region are 8% above the industry average Which one of the following results from the latest decision round are least important in providing guidance to company managers in deciding how to improve their company's overall performance and competitiveness versus rival companies in the upcoming decision round? The Demand Forecast data, the Potential Footwear Supply data, and the Production Facilities data for each company that are part of the Footwear Industry Overview on p. 4 of the FIR The credit rating data and the balance sheet data for each company on p 5 of the FIR The benchmarking data on pp. 6 and 7 of the FIR The Industry Scoreboard and each company's performance on EPS, ROE, stock price, credit rating, and image rating displayed on the first 3 pages of the FIR The information in the Comparative Competitive Efforts section of the Competitive Intelligence Report for each geographic region Assume a company's Income Statement for Year 12 is as follows: Income Statement Data Net Revenues from Footwear Sales Cost of Pairs Sold Warehouse Expenses Marketing Expenses Administrative Expenses Operating Profit (Loss) Interest Income (Expense) Pre-tax Profit (Loss) Income Taxes Net Profit (Loss) Year 12 (in 000s) $ 600,000 370,000 55,000 100,000 15,000 60,000 (12,000) 48,000 14,400 $ 33,600 Based on the above income statement data and the formula for calculating the interest coverage ratio described in the Help section for p. 5 of the Footwear Industry Report, the company's interest coverage ratio is 04.00. 03.00. 2.80 50.0. 5.00
