

Question
The La Ventana Window Company manufactures original equipment and replacement windows for residential building and remodeling applications. In a cutting process for a certain window
The La Ventana Window Company manufactures original equipment and replacement windows for residential building and remodeling applications. In a cutting process for a certain window model, specifications call for a dimension of 25.50 inches. If the dimension is larger than 25.52 inches, it will be too tight in assembly; and if it is 25.48 inches or less, it will be too loose and will not meet customer requirements. The plant manager collected a sample of 50 parts from this process and measured the dimensions. The data has been collected in the Microsoft Excel Online file below. Open the spreadsheet and perform the required analysis to answer the questions below.
Open spreadsheet
Questions:
1. Calculate the mean of the data. Round your answer to three decimal places.
fill in the blank 2
2. Calculate the median of the data. Round your answer to three decimal places.
fill in the blank 3
3. Calculate the standard deviation of the data. Round your answer to three decimal places.
fill in the blank 4
4. Find the minimum and maximum of the data. Round your answers to two decimal places.
Minimum: fill in the blank 5
Maximum: fill in the blank 6
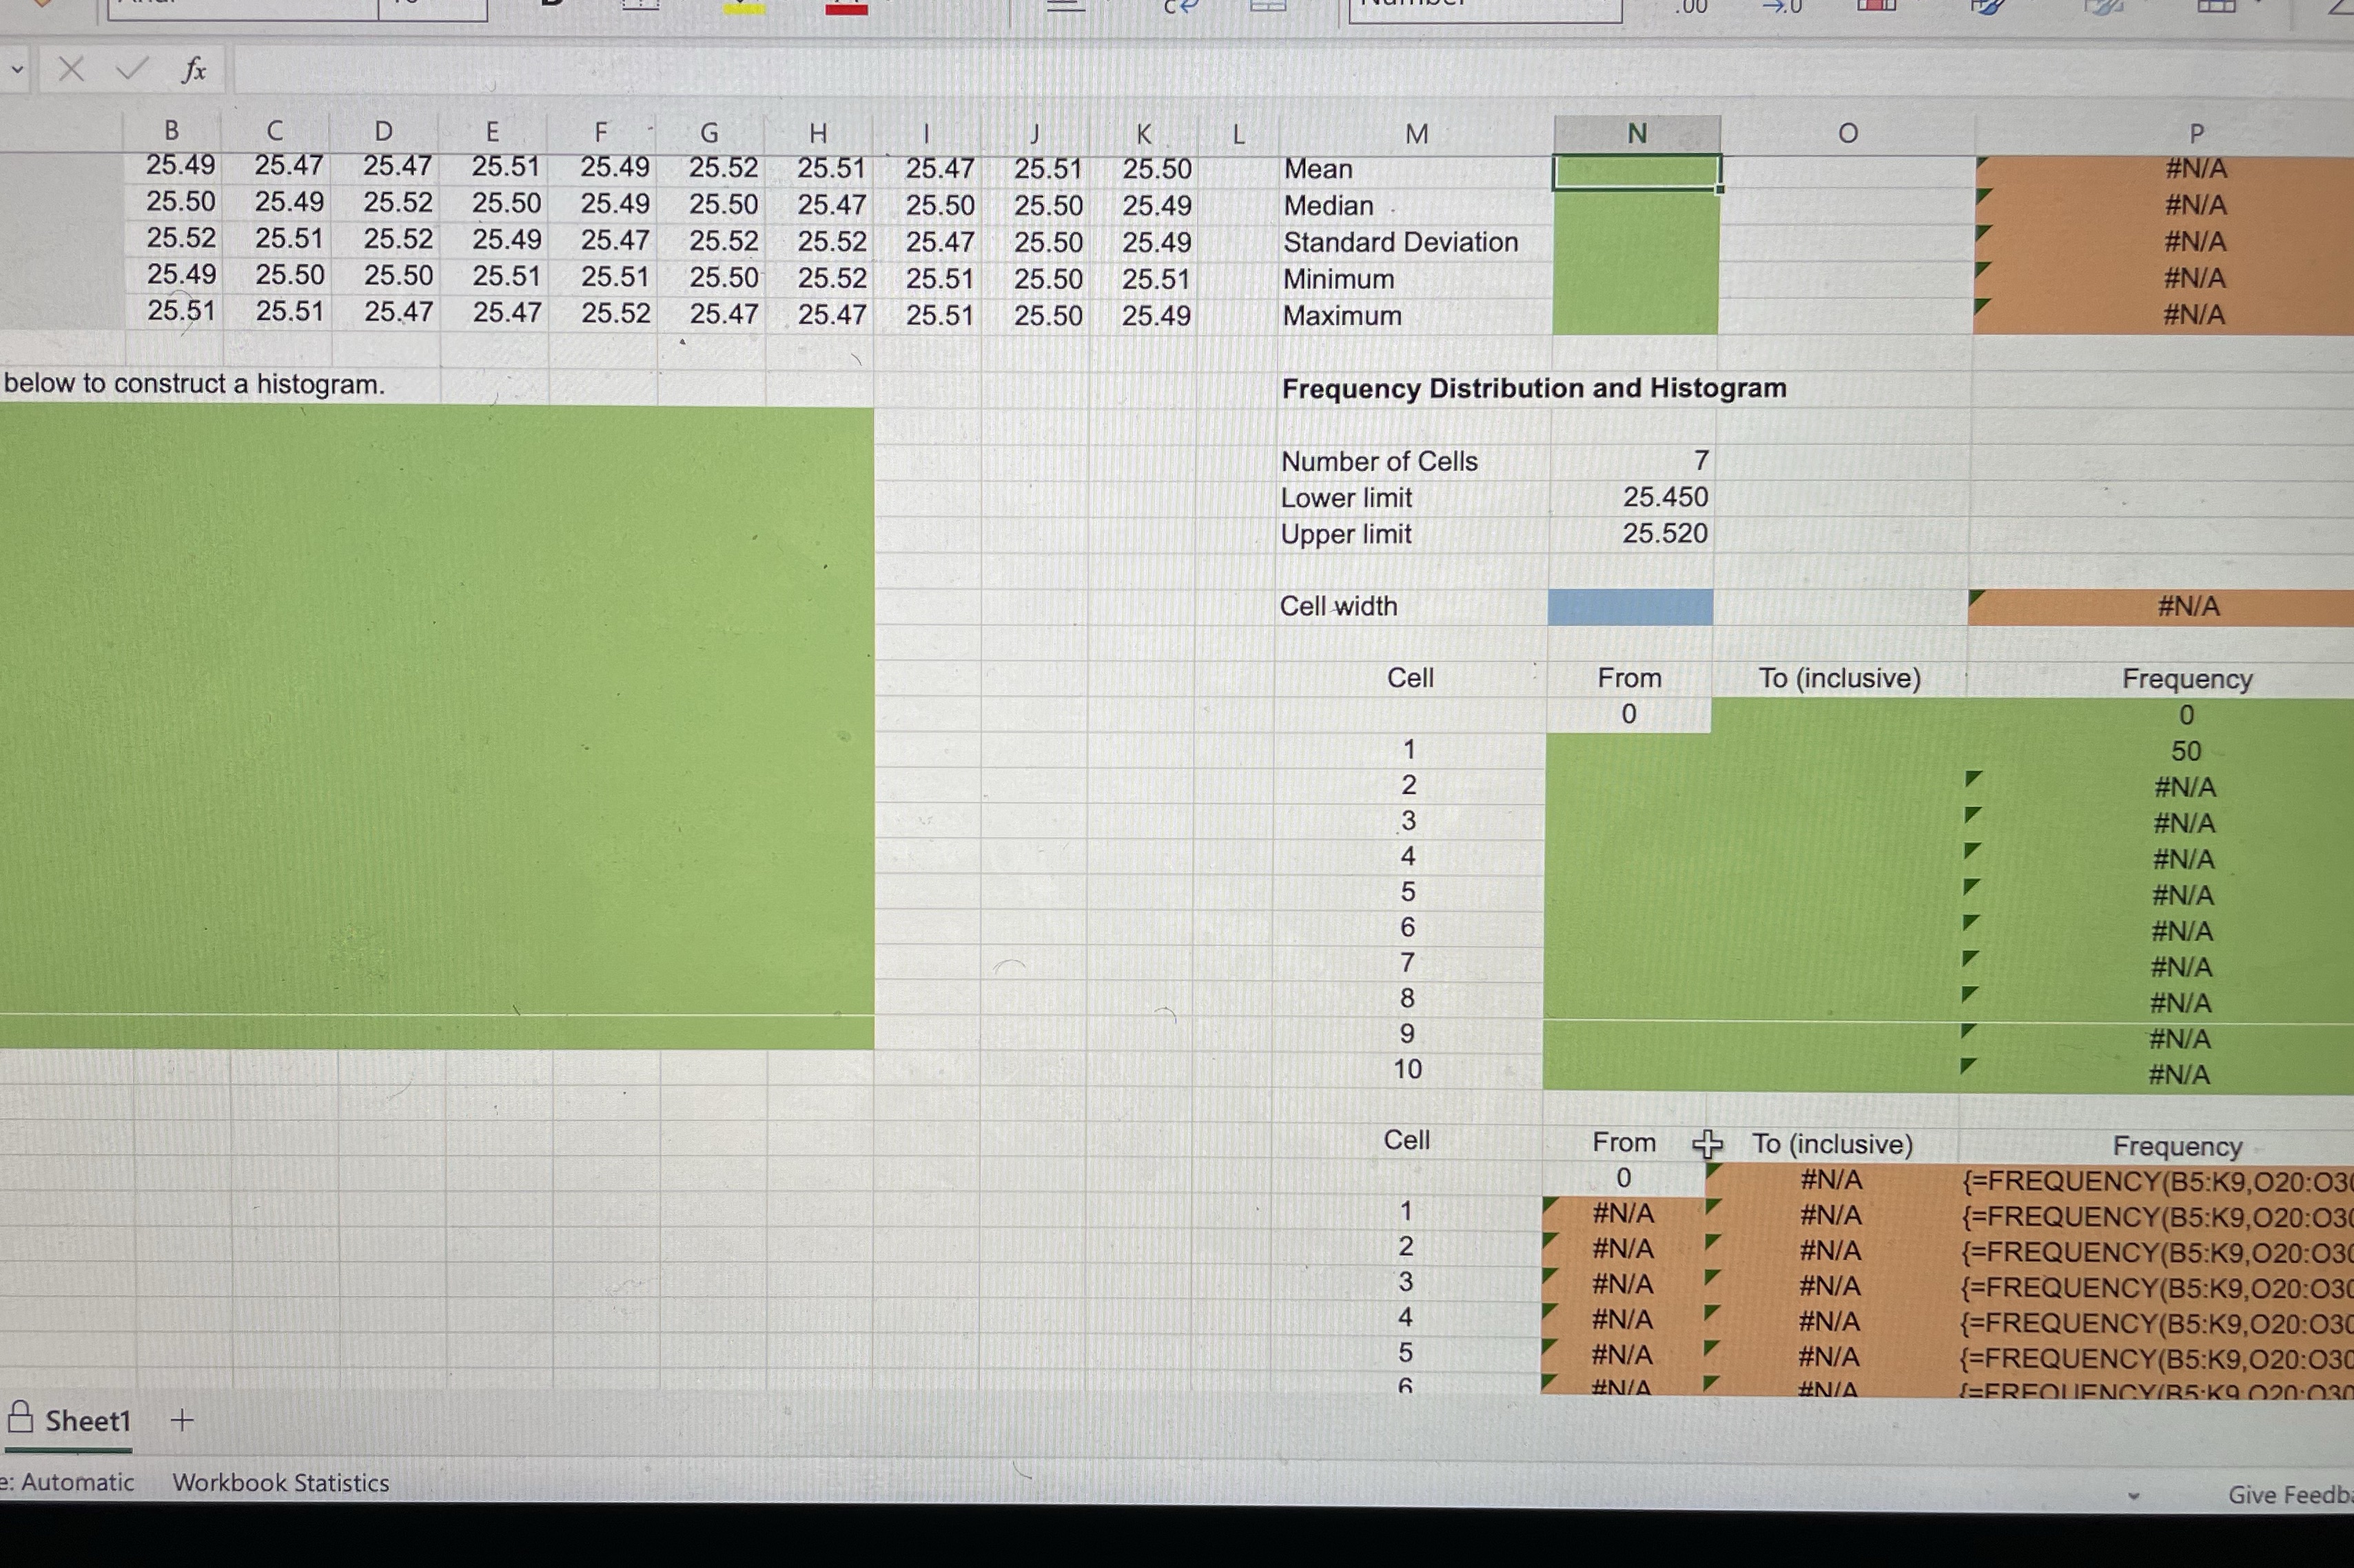
5. Construct the frequency distribution for the data. For calculating the cell width assume 7 cells, the lower limit of 25.45 inches and upper limit of 25.52 inches. Round your answers for interval boundaries to three decimal places and round your answers for frequencies to the nearest whole number.
| Cell | From | To (inclusive) | Frequency |
| 0 | fill in the blank 7 | fill in the blank 8 | |
| 1 | fill in the blank 9 | fill in the blank 10 | fill in the blank 11 |
| 2 | fill in the blank 12 | fill in the blank 13 | fill in the blank 14 |
| 3 | fill in the blank 15 | fill in the blank 16 | fill in the blank 17 |
| 4 | fill in the blank 18 | fill in the blank 19 | fill in the blank 20 |
| 5 | fill in the blank 21 | fill in the blank 22 | fill in the blank 23 |
| 6 | fill in the blank 24 | fill in the blank 25 | fill in the blank 26 |
| 7 | fill in the blank 27 | fill in the blank 28 | fill in the blank 29 |
| 8 | fill in the blank 30 | fill in the blank 31 | fill in the blank 32 |
| 9 | fill in the blank 33 | fill in the blank 34 | fill in the blank 35 |
| 10 | fill in the blank 36 | fill in the blank 37 | fill in the blank 38 |
6. Choose the correct histogram for the data.
The correct histogram is
histogram Ahistogram Bhistogram Chistogram D
.
| A. | Frequency Cell Upper Limit 25 20 15 10 5 0 25.550 25.540 25.530 25.520 25.510 25.500 25.490 25.480 25.470 25.460 |
| B. | Frequency Cell Upper Limit 25 20 15 10 5 0 25.550 25.540 25.530 25.520 25.510 25.500 25.490 25.480 25.470 25.460 |
| C. | Cell Upper Limit Frequency 25 20 15 10 5 0 25.550 25.540 25.530 25.520 25.510 25.500 25.490 25.480 25.470 25.460 |
| D. | Frequency Cell Upper Limit 25 20 15 10 5 0 25.550 25.540 25.530 25.520 25.510 25.500 25.490 25.480 25.470 25.460 |
Step by Step Solution
There are 3 Steps involved in it
Step: 1

Get Instant Access to Expert-Tailored Solutions
See step-by-step solutions with expert insights and AI powered tools for academic success
Step: 2

Step: 3
Ace Your Homework with AI
Get the answers you need in no time with our AI-driven, step-by-step assistance
Get Started
Strategic Management
Authors: John Pearce , Richard Robinson
13th Edition
0078029295, 978-0078029295