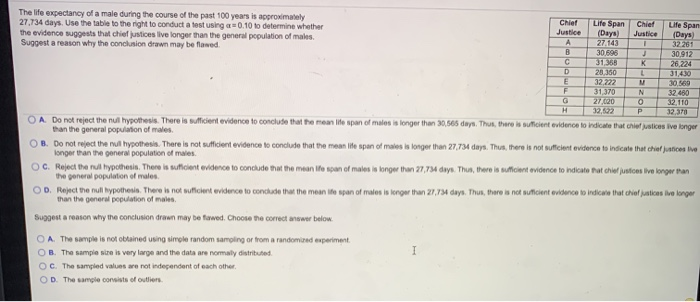
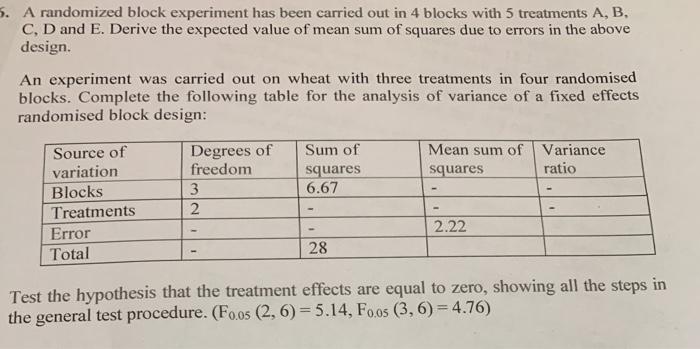
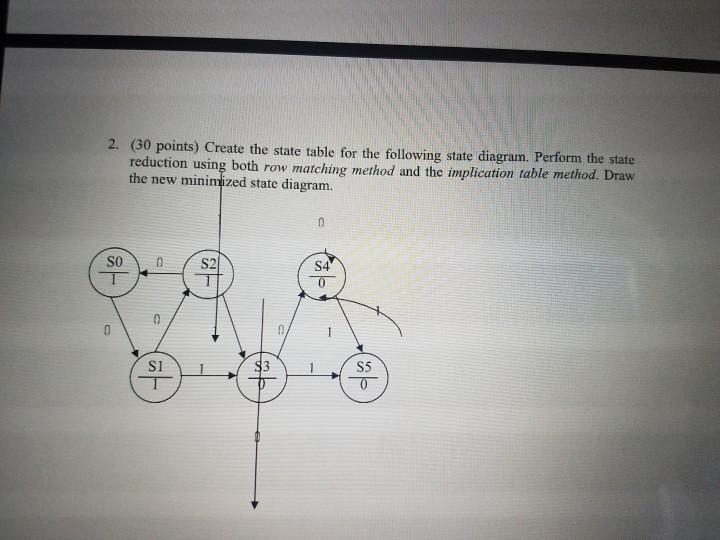
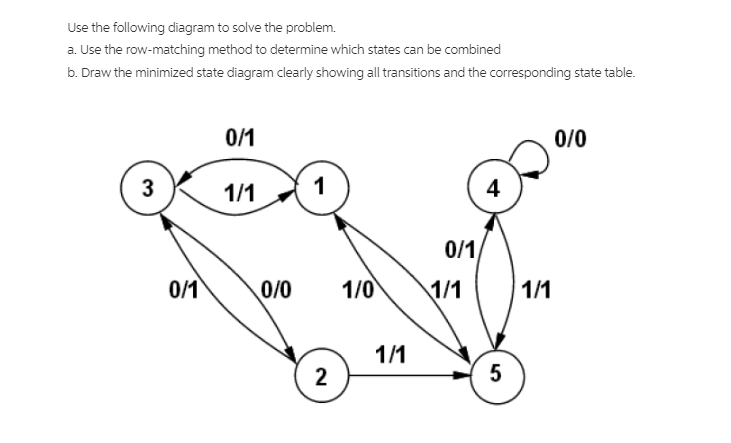
The life expectancy of a male during the course of the past 100 years is approximately Criat Life Span Life Span 27,734 days, Use the table to the right to conduct a test using a = 0.10 to determine whether Justice Days (Dys) the evidence suggests that chief justices live longer than the general population of makes, A 27.143 32 261 Suggest a reason why the conclusion drawn may be flawed. 30.696 30 912 C 26,224 20 150 31,430 32,222 30 80 31.370 N 32 460 27 020 32,110 32.172 P 32.370 O A Do not reject the null hypothesis. There is sufficient evidence to conclude that the mean life span of males is longer than 30,565 days. Thus, there is sufficient evidence to indicate that chief walkes live longer than the general population of males. O B. Do not reject the null hypothesis. There is not sufficient evidence to conclude that the mean life span of males is longer than 27,7:34 days. Thus, there is not sufleient evidence to indicate that chief juanpes live longer than the gonenal population of males. O C. Reject the null hypothesis. There is suficient evidence to conclude that the mean life span of males is longer than 27,7:34 days. Thus, there is suficient evidence to indicate that chief juslens live longer than the ponoral population of males. O D. Reject the null hypothesis. There is not sufficient evidence to conclude that the mein life span of males is longer than 27,7:34 days, Thus, there is not sufficient evidence to indicate that chief justices Bir longer than the general population of males. Suggest a reason why the conclusion driven may be flawed. Choose the correct answer below. O A. The sample is not obtained using simple random sampling or from a randomized experiment. O B. The sample size is very large and the data are normaly distributed. Q C. The sampled values are not independent of each other. O D. The sample consists of outlionA randomized block experiment has been carried out in 4 blocks with 5 treatments A, B, C, D and E. Derive the expected value of mean sum of squares due to errors in the above design. An experiment was carried out on wheat with three treatments in four randomised blocks. Complete the following table for the analysis of variance of a fixed effects randomised block design: Source of Degrees of Sum of Mean sum of Variance variation freedom squares squares ratio Blocks 3 6.67 Treatments 2 Error 2.22 Total 28 Test the hypothesis that the treatment effects are equal to zero, showing all the steps in the general test procedure. (Foos (2, 6) = 5.14, Foos (3, 6) = 4.76)2. (30 points) Create the state table for the following state diagram. Perform the state reduction using both row matching method and the implication table method. Draw the new minimized state diagram. SO 0 SI $5Use the following diagram to solve the problem. a. Use the row-matching method to determine which states can be combined b. Draw the minimized state diagram clearly showing all transitions and the corresponding state table. 0/1 0/0 3 1/1 1 4 0/1 0/1 0/0 1/0 1/1 1/1 1/1 2 5


