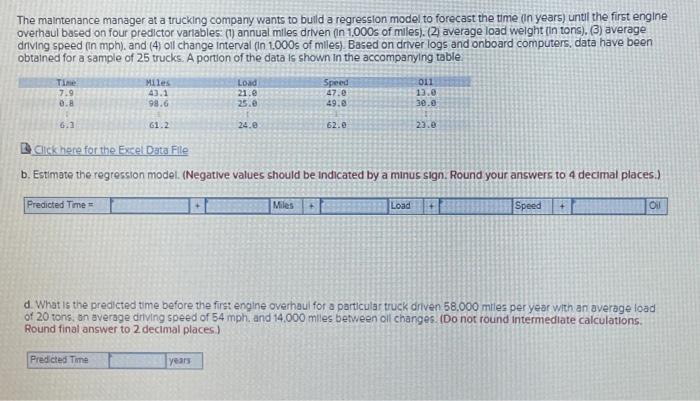
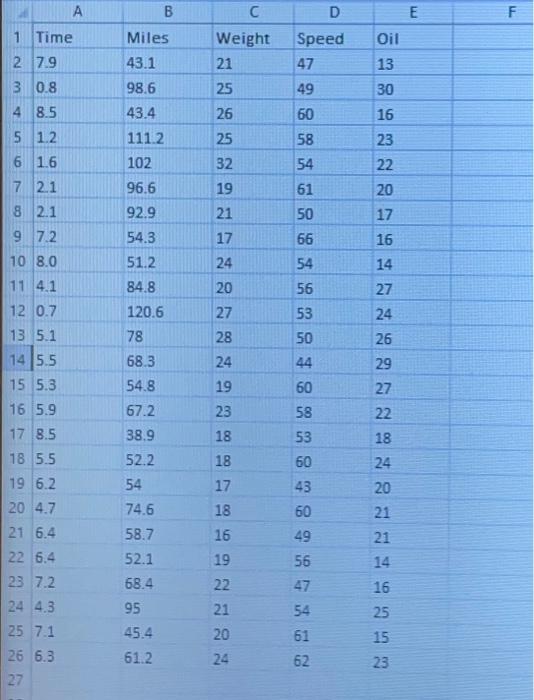
The maintenance manager at a trucking company wants to bulid a regression model to forecast the time (in years) until the first engine overhaul based on four predictor varlables: (1) annual miles driven (in 1,000s of miles). (2) average load welght (in tons), (3) average driving speed (in mph), and (4) oll change interval (in 1,000s of mlles). Based on driver logs and onboard computers, data have been obtained for a sample of 25 trucks. A portion of the data is shown in the accompanying table. B Clickhere for the Excel Data File b. Estimate the regression model. (Negative values should be indicated by a minus sign. Round your answers to 4 decimal places.) Predicted Time = d. What is the predicted time before the first engine overhaul for a particular truck driven 58.000 mrles per year with an average load of 20 tons, on zverage dilving speed of 54mph, and 14,000 miles between oll changes. (Do not round intermediate calculations. Round final answer to 2 decimal places) \begin{tabular}{|l|l|l|l|l|l|} \hline & \multicolumn{1}{|c|}{ A } & \multicolumn{1}{c|}{ B } & \multicolumn{1}{c|}{ D } & \\ \hline 1 & Time & Miles & Weight & Speed & Oil \\ \hline 2 & 7.9 & 43.1 & 21 & 47 & 13 \\ \hline 3 & 0.8 & 98.6 & 25 & 49 & 30 \\ \hline 4 & 8.5 & 43.4 & 26 & 60 & 16 \\ \hline 5 & 1.2 & 111.2 & 25 & 58 & 23 \\ \hline 6 & 1.6 & 102 & 32 & 54 & 22 \\ \hline 7 & 2.1 & 96.6 & 19 & 61 & 20 \\ \hline 8 & 2.1 & 92.9 & 21 & 50 & 17 \\ \hline 9 & 7.2 & 54.3 & 17 & 66 & 16 \\ \hline 10 & 8.0 & 51.2 & 24 & 54 & 14 \\ \hline 11 & 4.1 & 84.8 & 20 & 56 & 27 \\ \hline 12 & 0.7 & 120.6 & 27 & 53 & 24 \\ \hline 13 & 5.1 & 78 & 28 & 50 & 26 \\ \hline 14 & 5.5 & 68.3 & 24 & 44 & 29 \\ \hline 15 & 5.3 & 54.8 & 19 & 60 & 27 \\ \hline 16 & 5.9 & 67.2 & 23 & 58 & 22 \\ \hline 17 & 8.5 & 38.9 & 18 & 53 & 18 \\ \hline 18 & 5.5 & 52.2 & 18 & 60 & 24 \\ \hline 19 & 6.2 & 54 & 17 & 43 & 20 \\ \hline 20 & 4.7 & 74.6 & 18 & 60 & 21 \\ \hline 21 & 6.4 & 58.7 & 16 & 49 & 21 \\ \hline 22 & 6.4 & 52.1 & 19 & 56 & 14 \\ \hline 23 & 7.2 & 68.4 & 22 & 47 & 16 \\ \hline 24 & 4.3 & 95 & 21 & 54 & 25 \\ \hline 25 & 7.1 & 45.4 & 20 & 61 & 15 \\ \hline 26 & 6.3 & 61.2 & 24 & 62 & 23 \\ \hline \end{tabular} The maintenance manager at a trucking company wants to bulid a regression model to forecast the time (in years) until the first engine overhaul based on four predictor varlables: (1) annual miles driven (in 1,000s of miles). (2) average load welght (in tons), (3) average driving speed (in mph), and (4) oll change interval (in 1,000s of mlles). Based on driver logs and onboard computers, data have been obtained for a sample of 25 trucks. A portion of the data is shown in the accompanying table. B Clickhere for the Excel Data File b. Estimate the regression model. (Negative values should be indicated by a minus sign. Round your answers to 4 decimal places.) Predicted Time = d. What is the predicted time before the first engine overhaul for a particular truck driven 58.000 mrles per year with an average load of 20 tons, on zverage dilving speed of 54mph, and 14,000 miles between oll changes. (Do not round intermediate calculations. Round final answer to 2 decimal places) \begin{tabular}{|l|l|l|l|l|l|} \hline & \multicolumn{1}{|c|}{ A } & \multicolumn{1}{c|}{ B } & \multicolumn{1}{c|}{ D } & \\ \hline 1 & Time & Miles & Weight & Speed & Oil \\ \hline 2 & 7.9 & 43.1 & 21 & 47 & 13 \\ \hline 3 & 0.8 & 98.6 & 25 & 49 & 30 \\ \hline 4 & 8.5 & 43.4 & 26 & 60 & 16 \\ \hline 5 & 1.2 & 111.2 & 25 & 58 & 23 \\ \hline 6 & 1.6 & 102 & 32 & 54 & 22 \\ \hline 7 & 2.1 & 96.6 & 19 & 61 & 20 \\ \hline 8 & 2.1 & 92.9 & 21 & 50 & 17 \\ \hline 9 & 7.2 & 54.3 & 17 & 66 & 16 \\ \hline 10 & 8.0 & 51.2 & 24 & 54 & 14 \\ \hline 11 & 4.1 & 84.8 & 20 & 56 & 27 \\ \hline 12 & 0.7 & 120.6 & 27 & 53 & 24 \\ \hline 13 & 5.1 & 78 & 28 & 50 & 26 \\ \hline 14 & 5.5 & 68.3 & 24 & 44 & 29 \\ \hline 15 & 5.3 & 54.8 & 19 & 60 & 27 \\ \hline 16 & 5.9 & 67.2 & 23 & 58 & 22 \\ \hline 17 & 8.5 & 38.9 & 18 & 53 & 18 \\ \hline 18 & 5.5 & 52.2 & 18 & 60 & 24 \\ \hline 19 & 6.2 & 54 & 17 & 43 & 20 \\ \hline 20 & 4.7 & 74.6 & 18 & 60 & 21 \\ \hline 21 & 6.4 & 58.7 & 16 & 49 & 21 \\ \hline 22 & 6.4 & 52.1 & 19 & 56 & 14 \\ \hline 23 & 7.2 & 68.4 & 22 & 47 & 16 \\ \hline 24 & 4.3 & 95 & 21 & 54 & 25 \\ \hline 25 & 7.1 & 45.4 & 20 & 61 & 15 \\ \hline 26 & 6.3 & 61.2 & 24 & 62 & 23 \\ \hline \end{tabular}